Data has become the world's most valuable business asset. Every click, transaction, customer interaction, and business process generates enormous amounts of information. The challenge is no longer collecting data—it's transforming that data into meaningful business decisions.
This is where Power BI has become a game-changer.
In 2026, Power BI has evolved far beyond traditional reporting. With AI-powered insights, Microsoft Fabric integration, Copilot capabilities, and real-time analytics, organizations are making smarter decisions faster than ever before. Microsoft's recent updates continue to emphasize AI, enhanced reporting experiences, semantic modeling, and deeper Microsoft Fabric integration, making Power BI an even more powerful analytics platform.
Whether you're a fresher, working professional, business analyst, finance executive, or IT graduate, learning Power BI can significantly improve your career prospects.
Why Power BI Is One of the Most In-Demand Skills in 2026
The modern workplace runs on data.
Organizations across industries want professionals who can:
Convert raw data into meaningful insights
Create executive dashboards
Automate reporting
Identify business opportunities
Predict future trends
Support strategic decision-making
Instead of relying on static Excel reports, companies now expect interactive dashboards that update automatically.
Power BI makes this possible.
What's New in Power BI for 2026?
Power BI continues to evolve rapidly with features focused on AI-assisted analytics, smarter reporting, and enterprise-scale data management.
Some of the biggest trends include:
AI-powered Copilot for report creation
Microsoft Fabric integration
Direct Lake architecture
Semantic modeling improvements
Interactive storytelling dashboards
Better mobile analytics
Real-time data monitoring
Enhanced governance and security
Faster report performance
Improved Power Query experience
These innovations are making Power BI one of the most future-ready business intelligence platforms.
Why Businesses Prefer Power BI
Power BI offers a combination of simplicity, scalability, and powerful analytics.
Major advantages include:
Easy Data Connectivity
Connect with hundreds of data sources including:
Excel
SQL Server
Oracle
MySQL
Azure
Salesforce
Google Analytics
SAP
APIs
CSV Files
Interactive Dashboards
Instead of static reports, users can:
Drill into data
Apply filters
View trends
Compare KPIs
Explore business performance visually
AI-Powered Insights
Modern Power BI uses AI to:
Detect anomalies
Explain trends
Generate summaries
Forecast business performance
Suggest visualizations
Real-Time Analytics
Monitor:
Sales performance
Inventory
Manufacturing
Customer behavior
Financial transactions
Website traffic
as events happen.
Industries Hiring Power BI Professionals
Power BI skills are valuable across nearly every industry, including:
Banking
Healthcare
Retail
Manufacturing
IT Services
Telecommunications
E-Commerce
Insurance
Logistics
Education
Digital Marketing
Government
Any organization that uses data can benefit from Power BI expertise.
Top Job Roles After Learning Power BI
Learning Power BI opens doors to roles such as:
Power BI Developer
Business Intelligence Analyst
Data Analyst
Reporting Analyst
MIS Executive
Data Visualization Specialist
Business Analyst
Analytics Consultant
Financial Data Analyst
BI Engineer
These positions are in demand among startups, MNCs, consulting firms, and product-based companies.
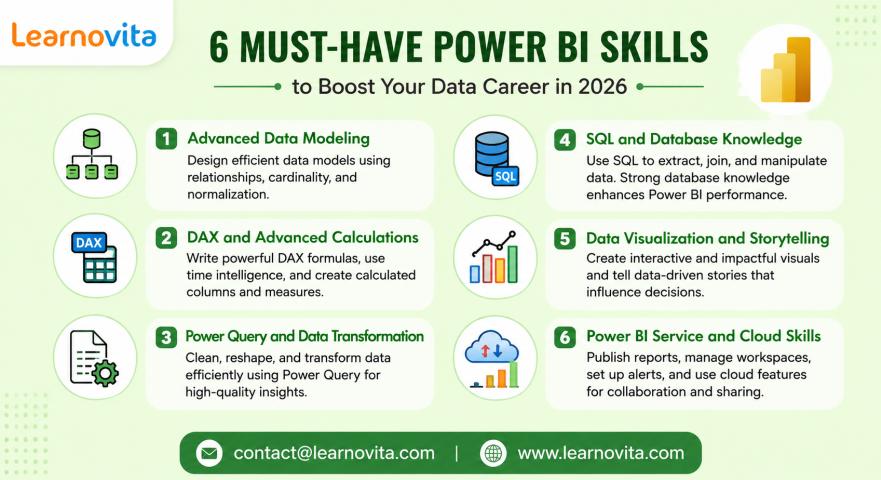
Essential Skills Every Power BI Professional Needs
A successful Power BI professional typically develops expertise in:
Data Preparation
Power Query
Data cleaning
Data transformation
Data integration
Data Modeling
Relationships
Star schema
Snowflake schema
Normalization
DAX (Data Analysis Expressions)
Learn to create:
Calculated columns
Measures
KPIs
Time intelligence
Advanced calculations
Dashboard Design
Create dashboards that are:
Interactive
User-friendly
Executive-ready
Mobile responsive
Data Storytelling
Great dashboards don't just display numbers—they tell a story that helps decision-makers act confidently.
Power BI vs Excel: Which Should You Choose?
Excel | Power BI |
|---|---|
Small datasets | Massive datasets |
Manual reporting | Automated dashboards |
Static charts | Interactive visuals |
Limited collaboration | Cloud sharing |
Basic analysis | AI-driven insights |
Individual use | Enterprise analytics |
Excel remains important, but Power BI is designed for scalable business intelligence.
Career Opportunities in 2026
Companies are actively seeking professionals who can:
Build dashboards
Automate reporting
Analyze customer behavior
Track KPIs
Improve business performance
Support AI-powered analytics
As organizations invest more in data-driven strategies, demand for Power BI professionals continues to grow alongside broader BI and AI adoption.
A Beginner's Roadmap to Learning Power BI
Step 1
Learn Excel fundamentals.
Step 2
Understand databases and SQL.
Step 3
Master Power BI Desktop.
Step 4
Learn Power Query.
Step 5
Master DAX formulas.
Step 6
Build interactive dashboards.
Step 7
Work on real-world business projects.
Step 8
Publish reports to the Power BI Service.
Step 9
Explore Microsoft Fabric.
Step 10
Build a professional analytics portfolio.
Real-World Power BI Project Ideas
Build projects such as:
Sales Dashboard
HR Analytics Dashboard
Financial Performance Dashboard
Hospital Analytics
Student Performance Dashboard
E-commerce Dashboard
Marketing Campaign Dashboard
Supply Chain Analytics
Customer Retention Dashboard
Manufacturing KPI Dashboard
These projects showcase practical skills that employers value.
Tips to Become a Successful Power BI Professional
Practice with real datasets.
Learn SQL alongside Power BI.
Understand business metrics and KPIs.
Focus on dashboard usability.
Learn DAX thoroughly.
Stay updated with Microsoft Fabric and Copilot features.
Build a GitHub or portfolio website.
Participate in Power BI community challenges.
Common Mistakes Beginners Should Avoid
Ignoring data modeling
Overloading dashboards with visuals
Poor color choices
Not optimizing report performance
Relying only on Excel knowledge
Skipping DAX practice
Not understanding business requirements
Building dashboards without a clear audience
Avoiding these pitfalls will help you progress more quickly.
Is Power BI Worth Learning in 2026?
Absolutely.
As businesses continue to embrace AI, cloud analytics, and self-service business intelligence, Power BI has become one of the most valuable skills for modern data professionals.
It combines data visualization, analytics, automation, and AI into a single platform, making it useful for professionals across technical and non-technical backgrounds.
Whether your goal is to become a Data Analyst, Business Intelligence Developer, Reporting Specialist, or Analytics Consultant, Power BI provides a strong foundation for a successful and future-ready career.
Frequently Asked Questions (FAQs)
Is Power BI difficult to learn?
No. Beginners can start with basic concepts and gradually advance to data modeling, DAX, and interactive dashboard development.
Does Power BI require coding?
Basic Power BI usage requires little to no coding. Advanced users benefit from learning DAX, Power Query (M), and SQL.
Can freshers learn Power BI?
Yes. Power BI is an excellent choice for graduates and career changers looking to enter the data analytics field.
Is Power BI useful with AI?
Yes. Modern Power BI integrates AI features such as Copilot, automated insights, and advanced analytics to accelerate report creation and decision-making.
Which industries use Power BI?
Finance, healthcare, retail, manufacturing, education, logistics, IT, telecommunications, e-commerce, government, and many other sectors use Power BI extensively.
Conclusion
Power BI has evolved into much more than a reporting tool—it's now a comprehensive business intelligence platform that combines analytics, automation, AI, and real-time decision support. With innovations like Microsoft Fabric, Copilot, and advanced semantic models, professionals who master Power BI are well-positioned for the future of data-driven business. Investing time in learning Power BI today can open doors to rewarding career opportunities and help you stay competitive in the rapidly changing world of analytics.