As software systems evolve, test suites grow alongside them. New features require new tests, bug fixes introduce additional validation, and over time, regression suites can become massive. While this growth..
Choosing the right web design tools in 2026 can directly impact how fast and effectively you build websites. With so many options available, making the right choice is more important..
In today’s crowded digital space, standing out for startups is a challenge. Startups building visibility with razor-thin budgets feel like they are shouting into the void that- every penny invested..
Small businesses often juggle multiple roles — from marketing to operations to customer support — leaving little room for error or delay. In 2026, AI automation tools are becoming essential..
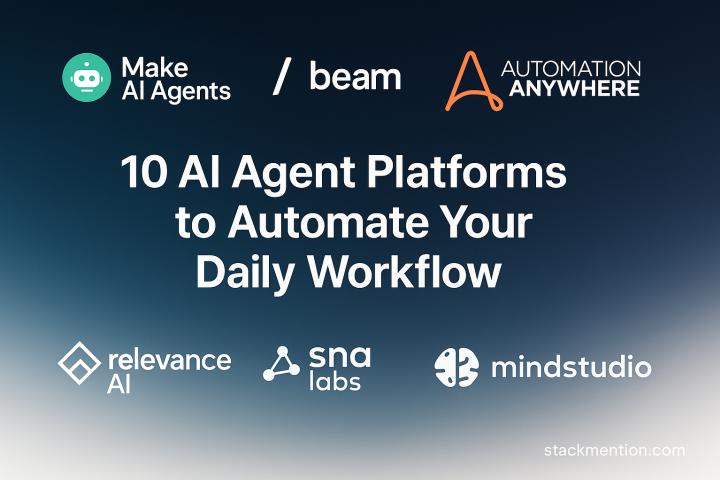
The way we interact with software is changing rapidly. Instead of logging into multiple apps and juggling dozens of dashboards, businesses are now exploring AI agent platforms, autonomous systems that..
Artificial intelligence has reshaped the way companies approach marketing, offering advanced solutions for automation, personalization, and data-driven decision-making. Among the wide range of AI-powered platforms, some stand out for their..
Over a few years, Tik Tok has become a viral video-sharing app and one of the most powerful social platforms in the world. TikTok has transformed the way consumers behave,..
Marketers today have more access to data than ever before. From website analytics to social media insights and CRM dashboards, every platform promises valuable signals about customer behavior. But with..
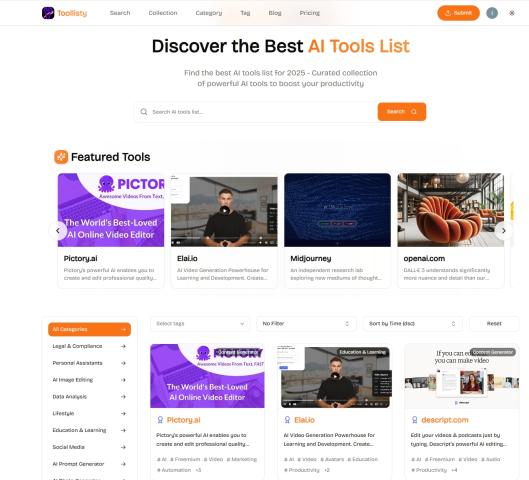
Artificial Intelligence (AI) is no longer a futuristic concept—it’s embedded in the way we work, learn, create, and innovate. Whether you're a developer, digital marketer, writer, designer, or entrepreneur, the..
Efficiency is crucial for survival in today’s competitive startup ecosystem. Founders are constantly looking for ways to optimize their workflows, reduce costs, and scale operations without dramatically increasing headcount. This..
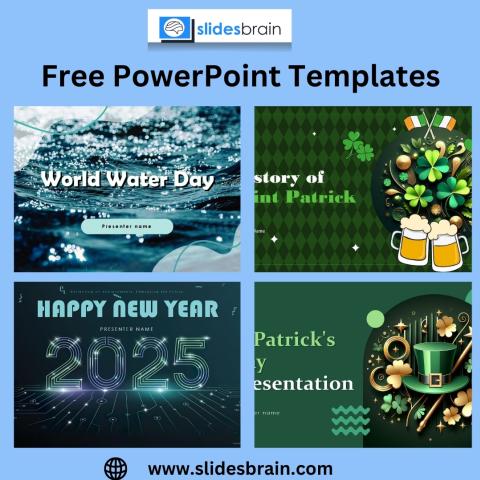
In today's fast-paced business environment, presentation tools like PowerPoint remain essential for pitching ideas, showcasing products, and sharing company visions. Free PowerPoint templates are widely used due to their convenience,..
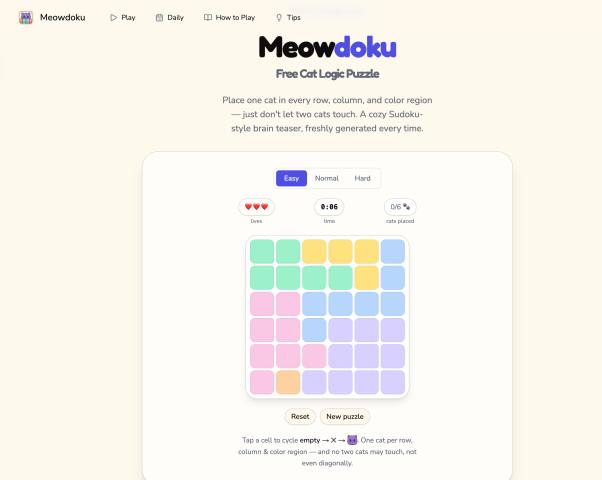
Most products treat the first 30 seconds as a chance to capture something — an email, an account, a tutorial completion. I built a small browser puzzle game and did..
Creative professionals need portfolios that do more than look attractive. A portfolio should show the right work, explain the creator’s >The best free portfolio website builders help creatives launch without..
The number of landlords running their own properties has grown steadily, and 2026 has given them more to think about than usual. The Renters' Rights Act 2025 came into force..
Converter Tool<a href="https://convertertool.net/"
target="_blank">Converter Tool</a> is a free online converter for video, image, JSON, audio, and everyday file tasks. Use it for popular workflows such as video to JPG, PNG..
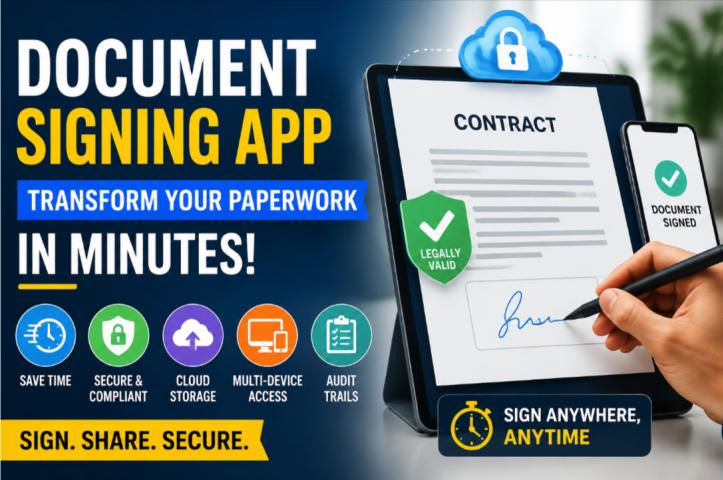
Table of ContentsBenefits of a Document Signing AppSpeed and EfficiencyLegal Compliance and SecurityKey Features to Look ForCloud Storage & AccessibilityMulti-Device SupportAudit TrailsHow to Start Using a Document Signing AppStep-by-Step SetupReal-World..
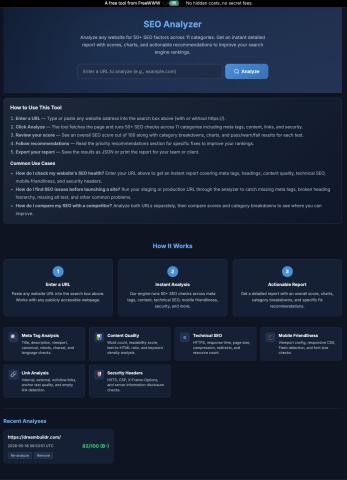
FreeWWW offers a complete suite of SEO tools that are 100% free and designed for marketers, bloggers, and business owners to optimize their websites efficiently. With these tools, users can..
10 Guilt-Free Treats That Deliver Premium Flavor Without Added SugarHealthy eating no longer means giving up desserts. Today’s consumers are becoming more mindful about sugar intake, but they still want..