Global HDPE Price Trends & Updates – Q2 2026
HDPE Prices 2026 showed a wide regional spread in Q2, with reported values ranging from USD 920/MT in China to USD 1,410/MT in the United Kingdom. The supplied Q2 dataset does not include a verified quarter-on-quarter percentage change, so a specific increase or decrease cannot be stated without introducing unsupported data. The HDPE price trend remained strongly differentiated by geography, reflecting differences in feedstock costs, production economics, trade exposure, and downstream demand. The HDPE Price Index provides a useful benchmark for procurement teams comparing regional values and tracking changes over time. Pricing data cited here is based on IMARC Group’s Q2 2026 price-tracking database and methodology.
HDPE Regional Price Snapshot: Q2 2026
- USA: USD 1308/MT
- China: USD 920/MT
- Germany: USD 1070/MT
- United Kingdom: USD 1410/MT
- Brazil: USD 1103/MT
The Q2 spread indicates substantial regional cost differences. The United Kingdom recorded the highest reported value at USD 1410/MT, while China was lowest at USD 920/MT. The USA stood at USD 1308/MT, followed by Brazil at USD 1103/MT and Germany at USD 1070/MT. Such differences can reflect feedstock economics, local production availability, import exposure, freight costs, currency effects, and downstream demand. For procurement teams, the spread reinforces the need to compare delivered costs rather than relying on a single global benchmark.
HDPE Price Analysis: Q2 2026
North America HDPE Prices: USA
The USA recorded USD 1308/MT in Q2 2026. The regional pricing position reflects the balance between domestic polyethylene production, ethylene feedstock availability, converter demand, and export flows. Packaging, containers, pipes, and industrial applications remain important demand channels. The supplied dataset does not provide a verified Q1 comparison, so a specific quarterly direction is not assigned.
Asia-Pacific HDPE Prices: China
China reported USD 920/MT, the lowest value among the five reported countries. Domestic manufacturing capacity, competitive regional supply, import economics, and demand from packaging and industrial applications can strongly influence purchasing conditions. Japan and India were listed in the requested regional grouping, but no verified Q2 2026 prices were supplied for either country; therefore, no figures or unsupported trends are assigned to them.
South America HDPE Prices: Brazil
Brazil recorded USD 1103/MT in Q2 2026. Local production, import requirements, freight, currency movements, and demand from packaging, agriculture, construction, and consumer-product applications influence purchasing economics. Without Q1 data, a precise quarterly percentage movement cannot be calculated.
United Kingdom and Germany: Reported Q2 Benchmarks
The supplied dataset also reports USD 1410/MT for the United Kingdom and USD 1070/MT for Germany. These values are included in the regional snapshot because they are verified inputs, but no separate Europe section is created, consistent with the requested structure.
HDPE Supply and Demand Overview – Q2 2026
Supply conditions were shaped by polyethylene plant operating rates, feedstock availability, maintenance schedules, and international trade flows. Producers with reliable ethylene access can maintain more competitive production economics, while outages or tighter feedstock supply can reduce regional availability.
On the demand side, packaging remains a major HDPE application, alongside pipes, containers, household products, agricultural products, and industrial components. Purchasing requirements therefore depend on both resin availability and the operating conditions of downstream converters.
HDPE Price Index and Historical Analysis: Q2 2026
The HDPE Price Index should be evaluated against previous quarterly observations to identify the direction and scale of price movement. However, the supplied information contains only Q2 2026 values and does not provide a Q1 index level or verified quarter-on-quarter percentage change.
The available Q2 benchmarks establish a clear geographic pricing hierarchy, with the United Kingdom at USD 1410/MT and China at USD 920/MT. Buyers can use an HDPE price history chart alongside quarterly index data to distinguish temporary regional movements from longer-term pricing patterns.
HDPE Price Forecast 2026: Next 12-Month Outlook
Over the next 12 months, HDPE pricing is expected to remain sensitive to crude oil and ethylene economics, plant operating rates, freight costs, inventory levels, and downstream packaging and industrial demand. New production capacity could increase supply availability and limit price gains, while unexpected outages could create temporary tightening.
A stronger construction, packaging, and consumer-goods cycle could support resin consumption. Conversely, slower manufacturing activity or elevated inventories could pressure prices. Procurement teams should therefore monitor regional supply balances rather than rely solely on a single global forecast.
Key Factors Affecting HDPE Prices: Quarterly Perspective
- Crude oil and ethylene costs: Changes in upstream feedstock costs influence polyethylene production economics.
- Production capacity: New plants can increase availability, while shutdowns can tighten supply.
- Packaging demand: Bottles, containers, films, and other packaging products are major HDPE consumption areas.
- Construction activity: HDPE pipes and related products link resin demand to infrastructure spending.
- Freight costs: Shipping and inland transportation affect imported and delivered resin costs.
- Plant operating rates: Higher utilization can improve availability, while outages can reduce supply.
- Trade flows: Imports, exports, tariffs, and regional arbitrage influence local pricing.
- Inventory levels: Producer and converter inventories can determine short-term purchasing pressure.
What Is HDPE And Where Is It Used?
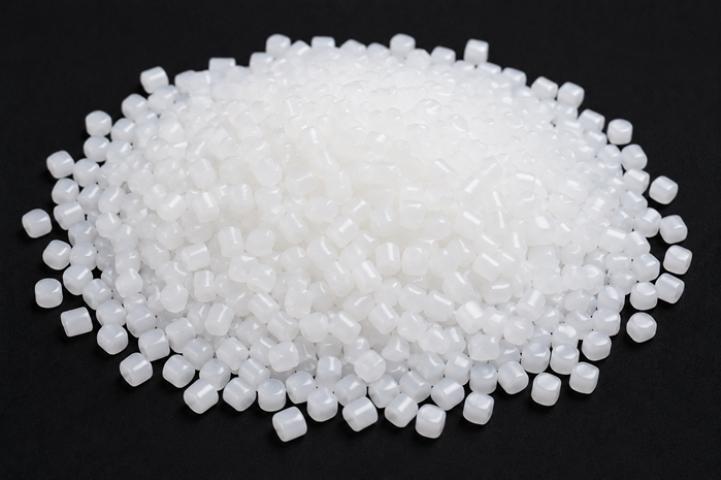
High-density polyethylene (HDPE) is a durable thermoplastic polymer produced primarily from ethylene. It offers high strength-to-density performance, chemical resistance, moisture resistance, and good processability.
The material is widely used in pipes, packaging containers, bottles, films, crates, drums, household products, agricultural applications, and industrial components. Its broad application base makes HDPE pricing relevant to converters, manufacturers, distributors, and procurement teams.
Recent HDPE Developments: Q2 2026 Highlights
Q2 2026 pricing showed a pronounced geographic spread, emphasizing the role of regional production economics and trade conditions. China’s USD 920/MT benchmark was materially below the United Kingdom’s USD 1410/MT, while the USA, Brazil, and Germany occupied intermediate positions.
The supplied brief does not include verified producer-specific capacity announcements, major supplier changes, or quantified trade shifts for Q2 2026. Accordingly, no unsupported company or capacity claims are added. IMARC Group’s quarterly tracking framework can help buyers monitor these developments as new pricing observations become available.
FAQs About HDPE Prices 2026
What Does the HDPE Price Chart Show for Q2 2026?
The HDPE Price Chart shows significant regional variation in Q2 2026, from USD 920/MT in China to USD 1410/MT in the United Kingdom. The difference reflects variations in supply, feedstock economics, logistics, and local demand.
What Is the HDPE Price Index for Q2 2026?
The HDPE Price Index is used to benchmark polyethylene pricing across tracked markets and periods. A verified Q1 index was not supplied with the Q2 dataset, so a specific quarter-on-quarter percentage change cannot be calculated accurately.
What Is the HDPE Price Forecast 2026?
The HDPE price forecast 2026 depends mainly on feedstock costs, production capacity, operating rates, freight, inventories, and downstream demand. Regional price differences are likely to remain important for procurement decisions over the next 12 months.
How IMARC Group Helps Track HDPE Prices
IMARC Group provides reliable HDPE pricing intelligence covering regional benchmarks, historical data, and future price trends. The Q2 2026 data shows clear price differences across major countries, helping buyers compare costs and assess supplier offers. By tracking feedstock costs, production capacity, freight rates, and downstream demand, businesses can better identify potential price changes. These insights can support procurement planning, supplier negotiations, and cost management over the next 12 months.
Explore pricing coverage across 500+ commodities: https://www.imarcgroup.com/pricing-market-reports
Contact Us:
IMARC Group
134 N 4th St., Brooklyn, NY 11249, USA
Email: sales[@]imarcgroup.com
Tel No:(D) +91 120 433 0800
United States: +1-201971-6302