It's 9 PM, snow is in the forecast, and you're refreshing three different weather apps hoping one of them will just tell you the answer. Will there be a snow day tomorrow, or are you setting five alarms for nothing?
A snow day calculator can't read your superintendent's mind, but it can get remarkably close by turning raw weather data into an actual probability. The problem is that most calculators just spit out a number without explaining where it came from. By the end of this guide, you'll know exactly how those percentages are built, how to calculate your own rough estimate by hand, and why snow days themselves have quietly changed since 2020.
What a Snow Day Calculator Actually Does
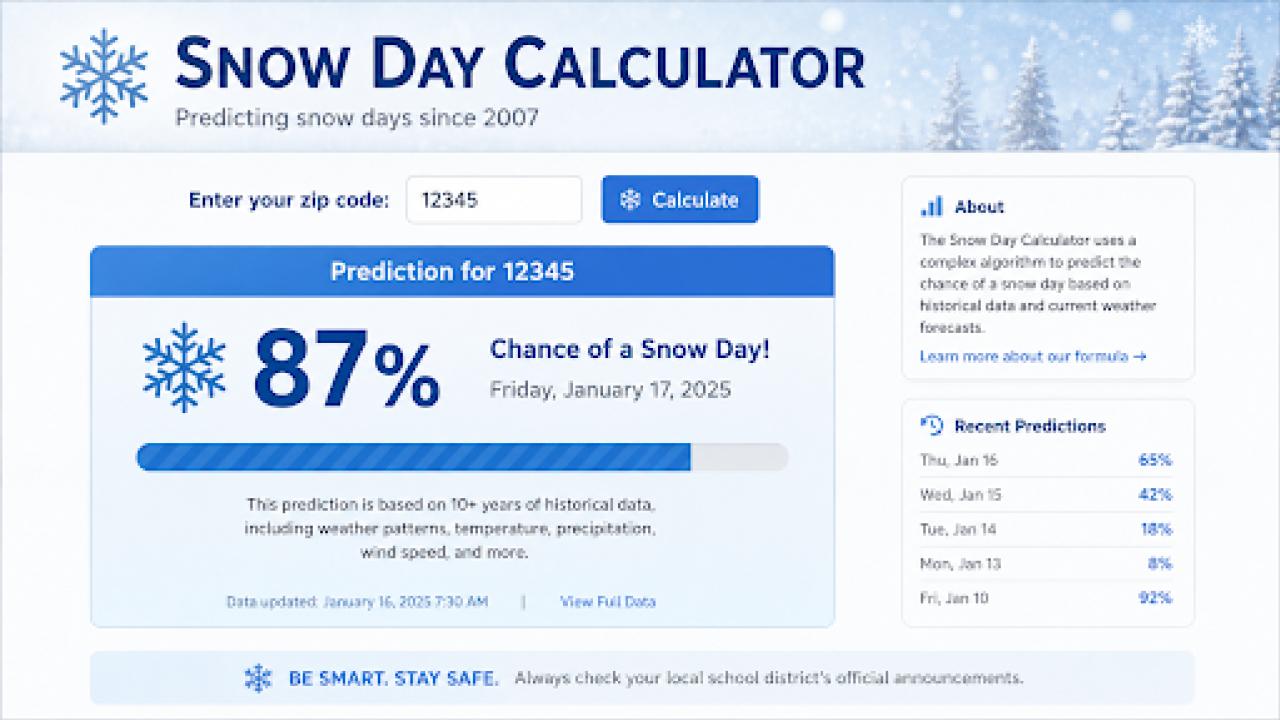
A snow day calculator & predictor pulls forecast data (snowfall totals, temperature, wind, ice risk, and storm timing) for your ZIP code and compares it against how your district has historically responded to similar conditions. The output is a probability, not a promise.
Think of it less like a fortune teller and more like a weather-savvy neighbor who's tracked every closure in your town for the last decade. It's informed, but the final call always belongs to a human administrator weighing road conditions, bus safety, and liability at 4:30 in the morning.
The 5 Factors Behind Every Real Prediction
Most calculators quietly use some version of the same five inputs. Here's what each one actually measures.
1. Accumulation Rate
How much snow falls, and how fast. Two inches over 12 hours is manageable. Two inches in 90 minutes during rush hour is not.
2. The Morning Crunch Window
Storms that peak between roughly 4 AM and 7 AM cause far more closures than storms that finish by midnight, because plows and bus routes haven't caught up yet.
3. Thermal Threat
Temperature and wind chill together. Sub-zero wind chill can close schools even without a flake of snow, due to frostbite risk at bus stops.
4. Surface Risk
Ice, freezing rain, and refreeze after a partial thaw are often more dangerous than snow itself, and they're the single biggest cause of "surprise" closures.
5. District Closure History
Some districts cancel at the first flurry; others push through blizzards. This behavioral pattern, built from years of past decisions, is what makes a 70% chance mean something different in Georgia than in Minnesota.
A Framework You Can Actually Use: The Closure Index
Here's a simple scoring method you can apply yourself, and feel free to cite or adapt it:
The Closure Index: Score each of the 5 factors above from 0 (no impact) to 5 (severe impact), sum the total, then divide by 25 and multiply by 100. A score above 65% typically signals a delay is likely; above 80% typically signals a full closure is likely in snow-sensitive districts.
It's not meteorology-grade precision, but it's a transparent, repeatable framework, which is more than most calculators offer.
Snow Day Thresholds Vary More Than You'd Think
Region | Typical "closure trigger" | Why |
Deep South | 1 to 2 inches | Almost no plows or salt trucks |
Mid-Atlantic | 3 to 5 inches | Moderate infrastructure |
Upper Midwest / Northeast | 8 to 12+ inches | Heavy plow fleets, cold-hardy roads |
Mountain West | Depends more on ice and wind than snowfall | Elevation and road grade matter most |
If you've ever wondered why your cousin in Texas got a week off for what your friend in Vermont calls "a dusting," this table is your answer.
How to Use a Snow Day Calculator the Right Way
Check once around 8 to 10 PM the night before. Forecast accuracy is highest in the 12 to 24 hour window.
Recheck at 5:30 AM. Overnight models update, and this is your last real data point before decisions get made.
Compare, don't rely on one source. Cross-reference with your district's actual notification system.
Watch the trend, not the snapshot. A probability climbing from 40% to 75% overnight tells you more than either number alone.
No Calculator Handy? Do It Manually
Pull up any weather app and answer these four questions yourself:
Is snowfall expected to exceed your region's typical threshold (see table above)?
Does the heaviest snow fall between 4 AM and 7 AM?
Is the wind chill below 0°F (-18°C) at bus-stop time?
Has this district closed for similar storms in the past two winters?
Three or more "yes" answers usually means a delay or closure is a strong possibility.
Rain Delay & Wind Chill Calculators
Our Rain Delay & Wind Chill Calculators can help you stay prepared no matter what conditions come your way. The Rain Delay Calculator estimates how long an outdoor event or match might be paused by looking at rainfall intensity, ground drainage conditions, and short-term forecasts, so you know whether to wait it out or change your plans. The Wind Chill Calculator, on the other hand, shows what the cold actually feels like on exposed skin once wind speed is factored in, which is often far lower than the number on your weather app. Together, these tools help you stay prepared and make quick, data-backed decisions no matter what the weather throws at you.
Why Snow Days Feel Rarer Since 2020
Many districts adopted Alternative Methods of Instruction (AMI) or remote e-learning days after pandemic-era school closures exposed how much instructional time was being lost. Instead of a full cancellation, students now often get an assigned online learning day. The storm still happens, but the "day off" doesn't. If your snow day predictions have felt less accurate lately, this policy shift, not the weather model, is usually the reason.
Mistakes People Make With Snow Day Predictions
Treating 90% as a guarantee. Districts have called school with higher odds than that.
Ignoring wind chill. Extreme cold closes more schools than people expect.
Checking too early. A forecast checked three days out is closer to a guess than a prediction.
Forgetting AMI days exist. A "high probability" storm might still mean logging into a laptop, not sledding.
Pro Tips
Districts bordering multiple counties often follow the most conservative neighbor's decision, so check nearby district patterns too.
Rural routes typically get more weight in closure decisions than urban ones, since bus routes take longer and cover more open road.
A late afternoon "flip" in forecast confidence (meteorologists call this a model trend shift) is often the earliest real signal, hours before any official statement.
Final Word
A snow day calculator won't replace the text alert from your school district, but it will get you out of the endless refresh-and-hope cycle. Check it the evening before, check it again at dawn, and now you actually understand the five factors doing the work behind that percentage. So, what's your area's magic number? Now you know exactly how to find out.