Global Copper Scrap Price Trends & Updates – Q2 2026
Copper Scrap Prices showed firm pricing conditions during Q2 2026, supported by copper demand, recycling activity, industrial consumption, and regional supply availability. The Copper Scrap Price Trend remained uneven across major consuming regions, with the supplied Q2 benchmarks ranging from USD 7,039/MT in the USA to USD 10,274/MT in India. The exact quarter-on-quarter percentage change was not included in the verified Q2 dataset provided for this report, so no unsupported percentage has been assigned. Buyers can review the Copper Scrap Price Historical Chart for broader historical and regional intelligence. IMARC Group's Q2 2026 price-tracking database and methodology indicate substantial regional differences, making location-specific benchmarks important for procurement and supplier negotiations.
Copper Scrap Prices Regional Snapshot: Q2 2026
- USA: USD 7039/MT
- China: USD 9235/MT
- Germany: USD 10232/MT
- France: USD 9952/MT
- India: USD 10274/MT
The Q2 benchmarks show a wide regional cost spread of USD 3235/MT between India and the USA. India recorded the highest supplied benchmark, followed by Germany and France, while China remained below the European and Indian levels. The USA had the lowest benchmark, indicating notable differences in scrap availability, domestic collection, fabrication demand, processing economics, freight, and trade flows. For buyers, this spread highlights the importance of comparing domestic and imported material on a landed-cost basis rather than relying on a single international reference.
Q2 2026 Price Analysis: How Do Regional Copper Scrap Prices Compare?
North America Copper Scrap Prices: USA Procurement Conditions
The USA benchmark stood at USD 7039/MT in Q2 2026. Pricing remained firm, supported by copper-intensive industrial activity and recycling demand, while domestic scrap collection and material availability influenced supplier offers. Lower pricing relative to the other supplied benchmarks also indicates different regional supply and cost structures.
Asia-Pacific Copper Scrap Prices: China and India Demand
China recorded USD 9235/MT, while India reached USD 10274/MT. Both markets remained important sources of copper scrap demand because of manufacturing, electrical equipment, construction, and recycling requirements. India recorded the highest supplied benchmark, while China's lower level reflected differences in local availability, trade flows, and purchasing conditions. Japan was included in the requested regional grouping, but no verified Q2 2026 Japan benchmark was supplied, so no price has been assigned.
Germany and France Copper Scrap Benchmarks: Q2 2026
Germany recorded USD 10232/MT, while France stood at USD 9952/MT. These supplied European benchmarks were higher than the USA and China, indicating stronger relative pricing conditions within the dataset. Since the brief specifically excludes a separate Europe section, Germany and France are presented here only as supplied country benchmarks rather than as an additional regional section.
Supply And Demand Overview – Q2 2026
Copper scrap availability remained closely linked to collection rates, industrial recycling, fabrication activity, and refined copper demand. Manufacturing, electrical equipment, construction, renewable-energy infrastructure, and automotive applications continued to support copper consumption. On the supply side, scrap generation depends on demolition, manufacturing waste, obsolete electrical equipment, and collection economics. Tight availability can quickly strengthen buying competition, particularly when smelters and refiners require additional secondary feedstock.
Copper Scrap Price Index & Historical Analysis: Q2 2026 Movement
The Copper Scrap Price Index should be assessed alongside quarterly changes in collection volumes, refined copper prices, smelter requirements, and regional trade flows. The verified Q2 dataset confirms a significant difference among major locations, but it does not provide a Q1 index value. Therefore, an exact quarter-on-quarter index percentage cannot be responsibly stated from the supplied data. Historical tracking remains useful for identifying recurring seasonal movements, changes in scrap generation, and shifts between primary and secondary copper demand.
Copper Scrap Price Chart: What Does the Q2 2026 Spread Show?
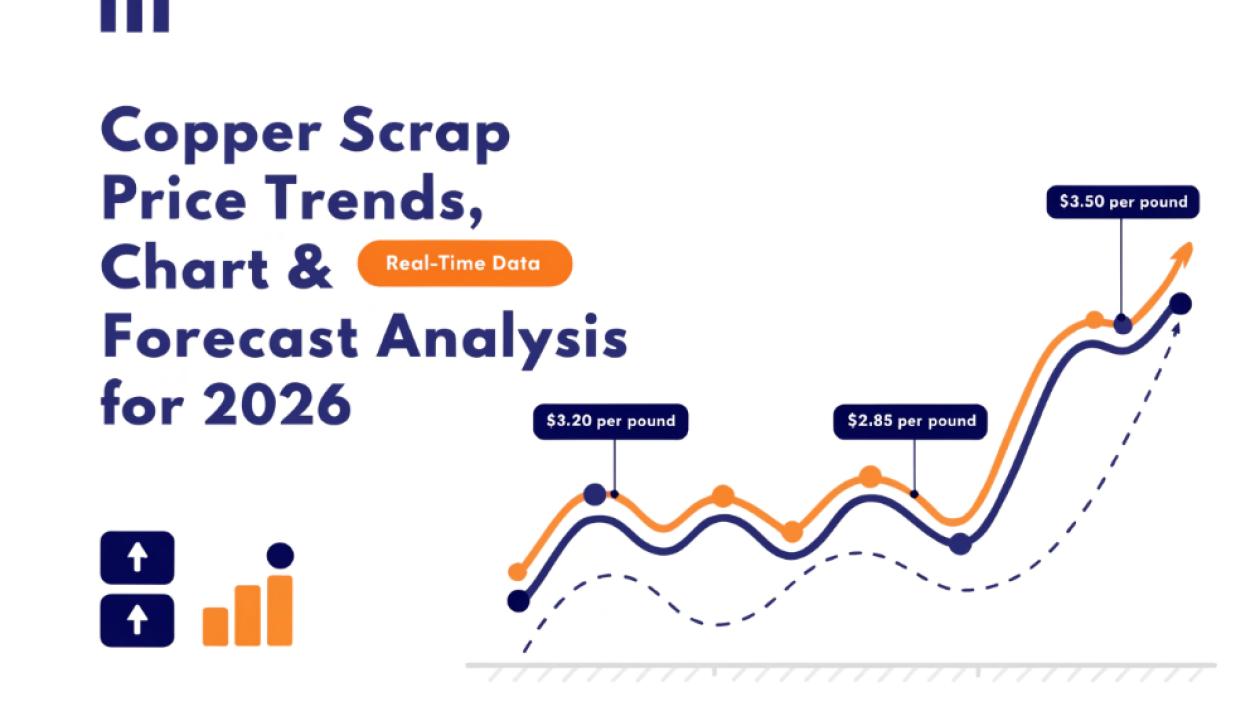
The Copper Scrap Price Chart for Q2 2026 shows India at the highest supplied benchmark of USD 10274/MT and the USA at the lowest at USD 7039/MT. The USD 3235/MT gap demonstrates how collection costs, regional demand, freight, trade policies, processing requirements, and local supply conditions can create substantial differences in procurement costs.
Copper Scrap Price Forecast 2026: What Could Happen Over the Next 12 Months?
Over the next 12 months, copper scrap pricing is expected to remain sensitive to refined copper prices, industrial production, recycling volumes, and global trade flows. Strong demand from electrical infrastructure, power equipment, construction, renewable-energy systems, and electric vehicles could support higher scrap values. Conversely, weaker manufacturing activity, increased collection volumes, or softer downstream consumption could limit price growth. Procurement teams should monitor regional spreads and supplier availability alongside benchmark prices when planning contracts.
Key Factors Affecting Copper Scrap Prices: Quarterly Cost Drivers
Several factors can influence quarterly procurement costs:
- Refined copper prices: Higher copper values generally improve scrap collection economics and supplier expectations.
- Industrial demand: Electrical, construction, automotive, and machinery sectors directly affect secondary copper consumption.
- Scrap availability: Collection rates and manufacturing scrap generation determine regional supply.
- Energy costs: Processing, sorting, shredding, and recycling operations are sensitive to electricity and fuel expenses.
- Freight costs: Ocean, road, and container freight can significantly change the landed cost of imported scrap.
- Trade policies: Import restrictions, tariffs, documentation requirements, and environmental regulations can redirect trade flows.
- Smelter and refinery demand: Higher requirements for secondary feedstock can increase competition for available scrap.
What Is Copper Scrap and Why Is It Important?
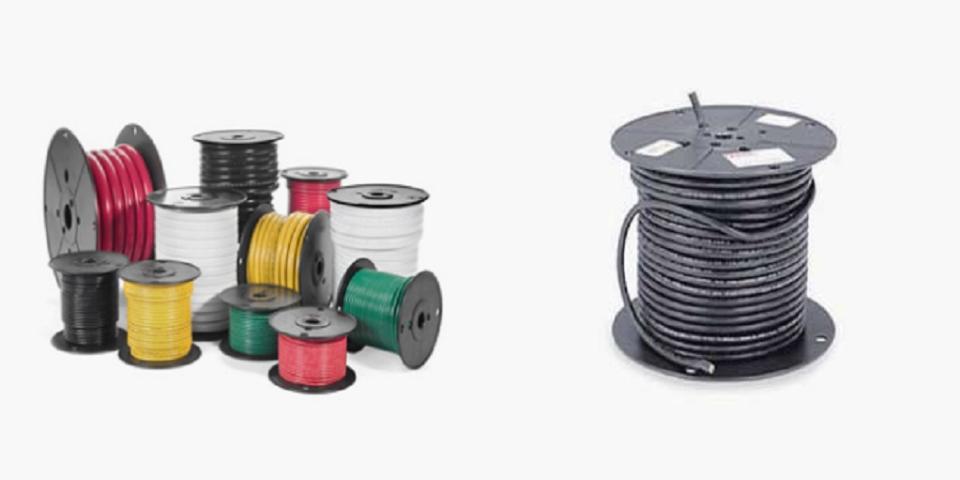
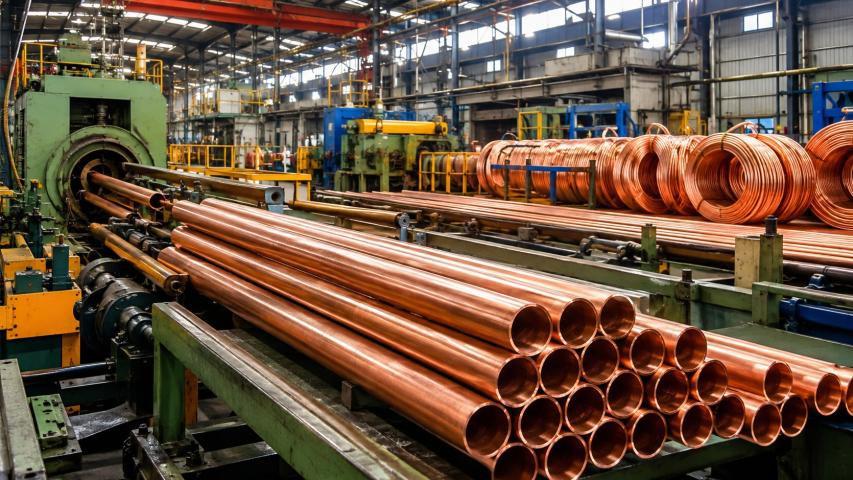
Copper scrap consists of recovered copper-containing material generated from manufacturing, construction, electrical equipment, demolition, cables, pipes, machinery, and end-of-life products. It is an important secondary raw material because copper can be recycled repeatedly while retaining its core material properties. Buyers typically assess scrap according to copper content, grade, contamination, processing requirements, origin, and delivered cost.
Recent Copper Scrap Developments: Q2 2026 Highlights
Q2 procurement conditions continued to reflect the broader focus on copper supply security and recycling. Growing demand for power infrastructure, electrical networks, renewable-energy equipment, data centres, and electrification increased the strategic importance of secondary copper. At the same time, changes in scrap collection, regional inventories, freight availability, and international trade rules influenced the competitiveness of imported versus domestic material. For procurement teams, these developments reinforce the need to monitor both refined copper benchmarks and physical scrap differentials.
FAQs About Copper Scrap Prices, Index and Forecast
What Were Copper Scrap Prices in Q2 2026?
The Q2 2026 benchmarks were USD 7039/MT in the USA, USD 9235/MT in China, USD 10232/MT in Germany, USD 9952/MT in France, and USD 10274/MT in India. India recorded the highest supplied benchmark, while the USA recorded the lowest.
How Did the Copper Scrap Price Index Change In Q2 2026?
The supplied Q2 dataset confirms significant regional price differences but does not include a Q1 index value or verified quarter-on-quarter percentage change. Therefore, an exact Q2 index movement should be taken from the relevant historical pricing series rather than estimated from the country benchmarks.
What Does the Copper Scrap Price Chart Show For 2026?
The Q2 benchmark comparison shows a USD 3235/MT spread between the highest and lowest supplied prices. This difference highlights the importance of regional supply, demand, processing costs, freight, trade conditions, and copper content when evaluating procurement offers.
How IMARC Group Helps with Copper Scrap Procurement Planning
IMARC Group provides copper scrap price data, historical trends, regional benchmarks, and forecasts to help businesses plan their purchases. Its Q2 2026 data show a significant price difference between India at USD 10274/MT and the USA at USD 7039/MT. This information helps buyers compare supplier prices, understand regional cost differences, set budgets, negotiate contracts, and make better sourcing decisions. Going forward, copper prices, recycling supply, industrial demand, freight costs, and trade policies are expected to continue influencing copper scrap procurement.
Explore pricing coverage across 500+ commodities: https://www.imarcgroup.com/pricing-market-reports
Contact Us:
IMARC Group
134 N 4th St. Brooklyn, NY 11249, USA
Email: sales[@]imarcgroup.com
Tel No:(D) +91 120 433 0800
United States: +1-201971-6302