
Introduction
Picture this: you're ready to transition into data analytics, a career path booming with opportunities and high demand. You enroll in an online course in data analytics, eager to dive in. But one question holds you back what tools should you focus on?
Whether you’re considering a Google data analytics certification or any online data analytics certificate, mastering the right tools can make or break your job readiness. Learning Excel alone won't cut it. Employers expect proficiency in a suite of modern, industry-relevant tools that drive real business decisions.
In this post, we’ll walk you through the best tools to learn in a data analytics course, complete with explanations, use cases, and how they fit into your future job. We’ll keep it hands-on, practical, and aligned with what hiring managers are actually looking for today.
Why Tools Matter in Data Analytics
Before we dive into the tools, let’s clarify why tool proficiency is essential in data analytics certification programs:
Hands-on skills separate candidates who “know the theory” from those who can “do the job.”
Tools enable the end-to-end process from data collection to storytelling with insights.
Industry-standard tools are expected in job descriptions and interviews.
In fact, studies show that 90% of data analyst job listings mention proficiency in at least three specific tools.
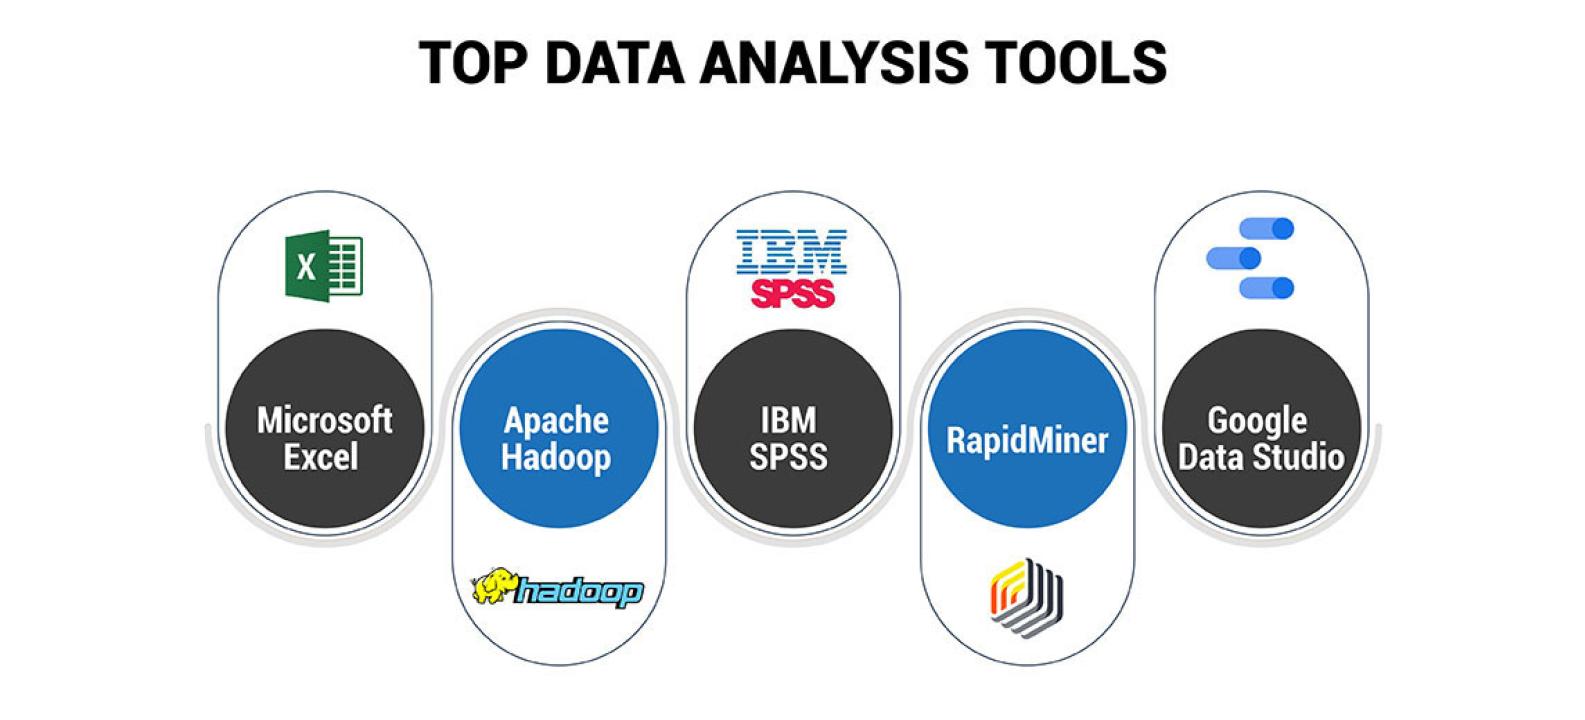
Let’s break down the most essential tools taught in a robust data analytics certificate online.
1. Microsoft Excel – The Foundation of Data Analysis
Why Excel Matters
Despite newer tools, Excel remains one of the most used data tools globally. Every online course in data analytics includes Excel for good reason.
Key Features to Learn:
Pivot Tables
VLOOKUP and XLOOKUP
Conditional Formatting
Data Validation
Power Query
Real-World Example:
A marketing analyst uses Excel to track weekly campaign performance and automate reports using pivot tables.
Tip for Learners:
Learn keyboard shortcuts and master Power Query early it sets you apart in interviews.
2. SQL – The Language of Data
Why SQL Is a Must-Have
Structured Query Language (SQL) is essential for querying databases. Every Online data analytics certificate emphasizes it because data lives in databases and SQL is how you access it.
What You Should Learn:
SELECT, WHERE, JOIN, GROUP BY, HAVING
Nested Queries
Window Functions
Creating Views
Subqueries
Real-World Example:
An operations analyst uses SQL to extract inventory data from a database, filter products by region, and identify bottlenecks in supply chains.
Hands-On Activity:
Try writing a query to count sales by product category for the last quarter. Start with:
sql
SELECT category, COUNT(*) AS sales_count
FROM sales_data
WHERE sale_date BETWEEN '2024-04-01' AND '2024-06-30'
GROUP BY category;
3. Python – For Advanced Data Analysis and Automation
Why Python Is Popular in Analytics
Python is powerful for data cleaning, exploration, automation, and even predictive modeling. It’s common in advanced online data analytics certificate courses.
Key Libraries to Know:
Pandas – Data manipulation
NumPy – Numeric computing
Matplotlib / Seaborn – Data visualization
Scikit-learn – Machine learning
Jupyter Notebooks – Interactive coding
Real-World Example:
A data analyst automates weekly customer churn prediction using a Python script that merges data, applies a logistic regression model, and outputs results to Excel.
4. R – Statistical Analysis and Visualization
When to Use R
R is often used in academia and roles focused on statistical analysis. While not always required, it is valued in certain industries like healthcare, economics, and research-heavy roles.
What to Learn:
Data manipulation with dplyr
Visualization with ggplot2
Statistical tests (t-test, ANOVA, regression)
RMarkdown for reporting
Real-World Application:
A public health analyst uses R to analyze vaccination trends and create interactive visual reports shared with local government officials.
5. Tableau – Visualizing and Presenting Insights
Why Tableau Is Industry Standard
Tableau allows analysts to transform data into interactive dashboards. It’s common in most Data Analytics certificate online due to its powerful storytelling capabilities.
Key Tableau Skills:
Connecting data sources
Creating calculated fields
Building dashboards
Using filters and parameters
Publishing and sharing reports
Real-World Example:
A business analyst builds a sales dashboard in Tableau that regional managers use to track team performance in real-time.
Visualization Tip:
Use color carefully too many can distract from the insight.
6. Power BI – Microsoft’s Answer to Tableau
Why Power BI Is Gaining Ground
Power BI is especially popular in Microsoft-based organizations. It integrates well with Excel, SharePoint, and Azure. Many data analytics certifications include it alongside Tableau.
Core Skills to Learn:
Importing data with Power Query
Data modeling with DAX
Building visuals and dashboards
Row-level security
Sharing and collaboration
Real-World Scenario:
A financial analyst uses Power BI to create a dashboard for monthly budget performance, combining multiple Excel and SQL sources.
7. Google Sheets – Collaboration and Cloud Accessibility
When Google Sheets Is the Right Tool
Google Sheets is widely used in startups, nonprofits, and agile teams. It offers real-time collaboration and cloud storage, making it part of many Google Data analytics certification.
Important Features:
QUERY function (similar to SQL)
IMPORTRANGE for pulling data across files
Data validation and conditional formatting
Add-ons like Google Analytics connector
Real-World Example:
A nonprofit analyst uses Google Sheets to track donations, with live updates shared across departments in real time.
8. Jupyter Notebooks – Documentation Meets Execution
Why It’s Worth Learning
Jupyter Notebooks combine code, results, and documentation in a single file. Perfect for Python users and ideal for projects.
Must-Know Features:
Markdown for explanations
Code cells for step-by-step execution
Integration with Pandas, Matplotlib, and Scikit-learn
Exporting reports as HTML or PDF
Real-World Use:
A data analyst at a logistics firm uses Jupyter to document the entire ETL (Extract, Transform, Load) process and share it with engineers and stakeholders.
9. Git and GitHub – Version Control and Collaboration
Why It Matters
Version control is a crucial skill in data teams. Even if you’re not a developer, knowing Git helps manage code, track changes, and collaborate on analytics projects.
What to Learn:
git init, commit, push, pull, branch
Using GitHub to host projects
Collaborating via pull requests
Documenting with README files
Real-World Application:
A team of analysts builds a data pipeline together using Python and SQL. They use GitHub to manage scripts and version changes.
10. Google Data Studio (Now Looker Studio)
Use for Easy, Cloud-Based Dashboards
Looker Studio allows anyone to create shareable dashboards using drag-and-drop tools. Many online courses in data analytics include it due to its Google ecosystem integration.
Features to Know:
Connect to Google Sheets, BigQuery, or Analytics
Filter controls
Drill-down capability
Sharing permissions
Real-World Example:
A digital marketer uses Looker Studio to share live PPC campaign performance with clients, connected directly to Google Ads.
Summary Table – Tools by Use Case
Tool | Primary Use | Skill Level | Cloud-Friendly | Taught In Certifications |
Excel | Basic analysis & reporting | Beginner | Yes | ✅ Yes |
SQL | Database querying | Beginner+ | Yes | ✅ Yes |
Python | Data wrangling & automation | Intermediate | Yes | ✅ Yes |
R | Statistics & visualization | Intermediate | Yes | ✅ Sometimes |
Tableau | Dashboards & storytelling | Beginner+ | Yes | ✅ Yes |
Power BI | Business dashboards | Beginner+ | Yes | ✅ Yes |
Google Sheets | Real-time collaboration | Beginner | ✅ Yes | ✅ Yes |
Jupyter Notebooks | Code + documentation | Intermediate | Yes | ✅ Yes |
Git/GitHub | Version control | Intermediate | Yes | ✅ Sometimes |
Looker Studio | Cloud dashboards | Beginner | ✅ Yes | ✅ Yes |
Key Takeaways
Choosing the right tools can fast-track your success in any data analytics certification.
Excel, SQL, and Python form the foundation of most job roles.
Visualization tools like Tableau and Power BI help you tell impactful stories with data.
Cloud-based and collaborative tools are in high demand as remote work continues to grow.
Hands-on practice with real datasets is essential just watching videos won’t get you job-ready.
Conclusion
Not all tools are equally important for every role. If you're leaning toward business analysis, prioritize Excel, SQL, and Tableau. If you're eyeing a more technical analyst role, go deeper into Python and Git. Whichever path you choose, start with a well-rounded Online course data analytics that focuses on these in-demand tools.
Start building your toolkit today with an online data analytics certificate program and become job-ready faster.
Let me know if you'd like a downloadable checklist or tool comparison chart to help you choose the right learning path!