Silica Sand Price Trends Analysis – North America Q2 2025 Overview
Silica Sand Prices in the United States:
Product | Category | Price |
Silica Sand | Chemical & Materials | US$57/MT |
In Q2 2025, Silica Sand Prices in the USA averaged US$57/MT, showing relative stability despite fluctuations in demand from the construction and glass industries. According to the latest Silica Sand Price Trend, steady supply and ongoing investments in industrial applications have kept the market balanced. However, energy costs and logistical challenges remain crucial factors influencing short-term pricing in the country.
Get the Real-Time Prices Analysis: https://www.imarcgroup.com/silica-sand-price-trend/requestsample
Note: The analysis can be tailored to align with the customer's specific needs.
Silica Sand Price Trends Analysis – APAC Q2 2025 Overview
Silica Sand Prices in China:
Product | Category | Price |
Silica Sand | Chemical & Materials | US$77/MT |
China recorded Silica Sand Prices at US$77/MT in Q2 2025, driven by rising consumption in glass manufacturing and electronics. The Silica Sand Price Trend highlights strong domestic demand combined with expanding export opportunities. While abundant reserves provide a steady supply, environmental regulations and fluctuating industrial output may affect market stability. China continues to be one of the most influential players in the global silica sand industry.
Regional Analysis: The price analysis can be extended to provide detailed Silica Sand price information for the following list of countries.
China, India, Indonesia, Pakistan, Bangladesh, Japan, Philippines, Vietnam, Thailand, South Korea, Malaysia, Nepal, Taiwan, Sri Lanka, Hong Kong, Singapore, Australia, and New Zealand, among other Asian countries.
Silica Sand Price Trends Analysis – Europe Q2 2025 Overview
Silica Sand Prices in Germany:
Product | Category | Price |
Silica Sand | Chemical & Materials | US$81/MT |
In Germany, Silica Sand Prices averaged US$81/MT during Q2 2025, reflecting robust demand from automotive and construction sectors. The Silica Sand Price Trend shows that higher energy and labor costs in Europe are contributing to price elevation. Additionally, sustainability measures and recycling initiatives are reshaping procurement strategies, ensuring long-term demand remains steady. Germany’s strong industrial base positions it as a key consumer in the European silica sand market.
Regional Analysis: The price analysis can be expanded to include detailed Silica Sand price data for a wide range of European countries:
such as Germany, France, the United Kingdom, Italy, Spain, Russia, Turkey, the Netherlands, Poland, Sweden, Belgium, Austria, Ireland, Switzerland, Norway, Denmark, Romania, Finland, the Czech Republic, Portugal, and Greece, along with other European nations.
Silica Sand Price Trends Analysis – MEA Regions Q2 2025 Overview
Silica Sand Prices in Saudi Arabia:
Product | Category | Price |
Silica Sand | Chemical & Materials | US$63/MT |
Saudi Arabia reported Silica Sand Prices at US$63/MT in Q2 2025, supported by continuous investments in infrastructure and industrial growth. The Silica Sand Price Trend highlights a stable domestic supply from abundant reserves, ensuring competitive pricing compared to global peers. With the Kingdom focusing on expanding the glass and construction industries under Vision 2030, silica sand demand is expected to grow further, keeping prices favorable for local industries.
Silica Sand Prices in Turkey:
Product | Category | Price |
Silica Sand | Chemical & Materials | US$75/MT |
In Turkey, Silica Sand Prices averaged US$75/MT in Q2 2025. The Silica Sand Price Trend reflects healthy demand from both domestic industries and exports to Europe and the Middle East. Turkey’s strategic location and resource availability make it a competitive supplier in the global market. However, currency fluctuations and rising transportation costs could create price volatility, though strong regional demand continues to provide market stability.
Regional Analysis: The price analysis can be extended to provide detailed Silica Sand price information for the following list of MEA countries.
Saudi Arabia, UAE, Israel, Iran, South Africa, Nigeria, Oman, Kuwait, Qatar, Iraq, Egypt, Algeria, and Morocco, among other Middle Eastern and African countries.
Key Factors Affecting Silica Sand Price Trend, Index, and Forecast (2025):
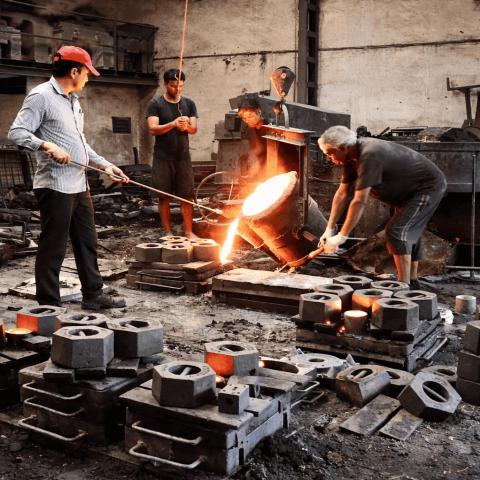
- Construction & Industrial Demand: Strong demand from construction, glass, and fracking industries continues to drive prices, especially in the US, Middle East, and parts of Asia.
- Supply & Mining Regulations: Regional supply is impacted by environmental policies and mining restrictions, particularly in Europe and China, influencing global price trends.
- Energy & Production Costs: Rising costs of fuel, labor, and processing equipment increase overall production expenses, contributing to price growth.
- Logistics & Freight: Transportation costs and port congestion affect landed prices, especially in regions dependent on imports or bulk exports.
- Quality & Application: High-purity silica for glass and electronics commands premium prices compared to construction-grade sand.
- Currency & Trade: Fluctuating exchange rates and trade policies impact global Price Trends, especially in export-driven markets like Turkey, India, and China.
2025 Silica Sand Price Outlook:
Silica Sand prices are expected to remain moderately strong, supported by growing demand, rising production costs, and regional supply constraints. Forecasts show continued price variations across regions, with construction and industrial recovery shaping future trends.
Key Coverage:
- Market Analysis
- Market Breakup by Region
- Demand Supply Analysis by Type
- Demand Supply Analysis by Application
- Demand Supply Analysis of Raw Materials
- Price Analysis
- Spot Prices by Major Ports
- Price Breakup
- Price Trends by Region
- Factors influencing the Price Trends
- Market Drivers, Restraints, and Opportunities
- Competitive Landscape
- Recent Developments
- Global Event Analysis
FAQs About the Silica Sand Price Trends, Index & Forecast:
What are the latest Silica Sand prices in major regions?
As of Q2 2025, Silica Sand prices range from US$57/MT in the USA to US$81/MT in Germany, with variations across China, Saudi Arabia, and Turkey. These differences are shaped by local demand, production capacity, and export activity. Buyers often track the Silica Sand Price Trend and the Silica Sand Price History Chart to forecast regional procurement costs.
What factors are influencing the Silica Sand Price Trend in 2025?
The Silica Sand Price Trend in 2025 is largely impacted by rising demand from construction, glassmaking, solar panels, and foundries. Supply chain dynamics, energy prices, and export policies also play a key role. Reviewing the Silica Sand History Price Chart helps businesses understand how global demand and raw material costs continue to shape regional price variations.
How can the Silica Sand History Price Chart help buyers plan procurement?
The Silica Sand History Price Chart provides valuable insights into seasonal price fluctuations, long-term demand cycles, and regional cost stability. By studying historical data, buyers and traders can optimize procurement strategies, minimize risks from volatility, and secure competitive sourcing contracts—especially in high-demand regions like Asia and the Middle East.
Which industries are driving the global Silica Sand demand in 2025?
Key industries fueling demand include construction (cement and concrete), glass manufacturing, ceramics, foundries, and solar panel production. With renewable energy adoption on the rise, demand for silica-based solar glass is surging. These sectors directly influence the Silica Sand Price Trend, creating new opportunities for suppliers and exporters worldwide.
Where can I access real-time Silica Sand price forecasts and detailed market analysis?
Businesses looking for accurate and updated pricing can access IMARC’s detailed reports, which include the Silica Sand Price Trend, regional analysis, and future outlook. The reports also feature the Silica Sand History Price Chart and customized procurement insights, helping companies make informed buying decisions and secure long-term supply contracts.
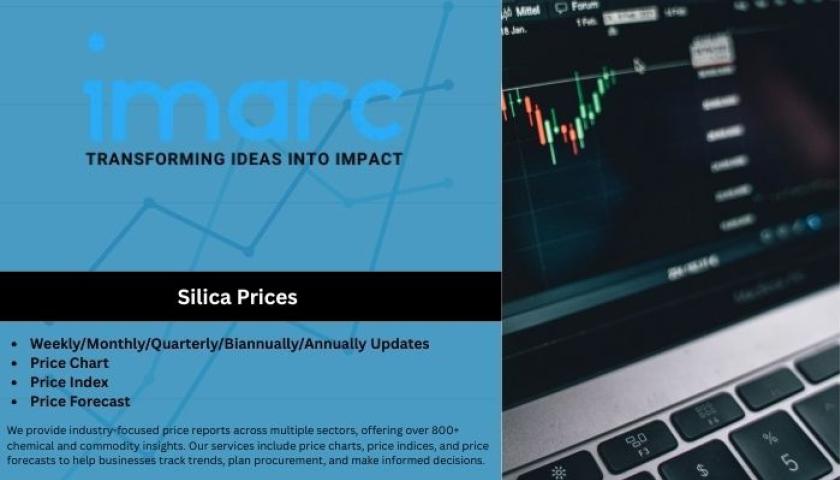
How IMARC Price Trends Database Can Help
The latest IMARC Group study, Silica Sand Prices, Trend, Chart, Demand, Market Analysis, News, Historical and Forecast Data 2025 Edition, presents a detailed analysis of the Silica Sand price trend, offering key insights into global Silica Sand market dynamics. This report includes comprehensive price charts, which trace historical data and highlight major shifts in the market.
The analysis delves into the factors driving these trends, including raw material costs, production fluctuations, and geopolitical influences. Moreover, the report examines Silica Sand demand, illustrating how consumer behaviour and industrial needs affect overall market dynamics. By exploring the intricate relationship between supply and demand, the prices report uncovers critical factors influencing current and future prices.
About Us:
IMARC Group is a global management consulting firm that provides a comprehensive suite of services to support market entry and expansion efforts. The company offers detailed market assessments, feasibility studies, regulatory approvals and licensing support, and Price Trends analysis, including spot Price Trends and regional price trends. Its expertise spans demand-supply analysis, alongside regional insights covering the Asia-Pacific, Europe, North America, Latin America, the Middle East, and Africa. IMARC also specializes in competitive landscape evaluations, profiling key market players, and conducting research into market drivers, restraints, and opportunities. IMARC’s data-driven approach helps businesses navigate complex markets with precision and confidence.
Contact Us:
IMARC Group
134 N 4th St., Brooklyn, NY 11249, USA
Email: sales[@]imarcgroup.com
Tel No:(D) +91 120 433 0800
United States: +1-201971-6302