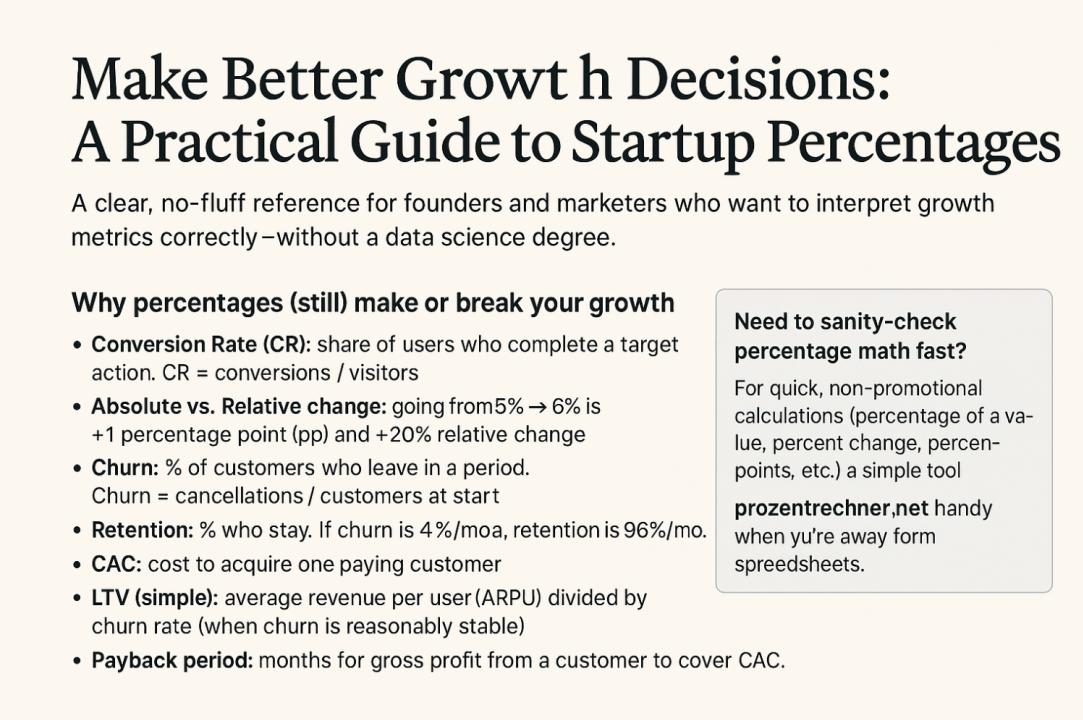

A clear, no-fluff reference for founders and marketers who want to interpret growth metrics correctly—without a data science degree.
Why percentages (still) make or break your growth
Most startup dashboards are packed with percentages—conversion rate, churn, retention, open rate, CTR, uplift, you name it. The tricky part isn’t calculating them; it’s interpreting them correctly so your next move is obvious. This guide gives you the essentials, common pitfalls, and ready-to-use examples you can adapt to your product today.
Quick glossary you’ll actually use
- Conversion Rate (CR): share of users who complete a target action.
CR = conversions / visitors - Absolute vs. Relative change: going from 5% → 6% is +1 percentage point (pp) and +20% relative change.
- Churn: % of customers who leave in a period.
Churn = cancellations / customers at start - Retention: % who stay. If churn is 4%/mo, retention is 96%/mo.
- CAC: cost to acquire one paying customer.
- LTV (simple): average revenue per user (ARPU) divided by churn rate (when churn is reasonably stable).
- Payback period: months for gross profit from a customer to cover CAC.
1) Conversion rate changes: talk in percentage points and relative uplift
Scenario: Your signup conversion goes from 3.0% to 3.6% after a landing-page change.
- Absolute change: +0.6 pp
- Relative change: +20% (because 0.6 ÷ 3.0 = 0.20)
Both numbers matter. Percentage points tell stakeholders how much the rate itself moved; relative change tells you “how big” the win was vs. baseline. Reporting only “+20%” can sound huge when the base is tiny.
Back-of-the-napkin impact
At 50,000 monthly visitors, +0.6 pp means 300 additional signups (0.006 × 50,000). If your activation rate is 40%, that’s ~120 more activated users—before downstream monetization.
2) Churn & retention: convert monthly rates to annual reality
Rule of thumb: small monthly churn compounds across a year.
If monthly churn is 4%, monthly retention is 96%.
Annual retention ≈ 0.9612 ≈ 61.7%. That means ~38.3% of your customers will be gone after a year if nothing changes.
This compounding is why reducing churn by even 0.5–1.0 pp monthly can drive outsized long-term LTV improvements.
3) LTV, CAC & payback: keep the percentages consistent
Simple LTV (for subscription with stable churn)
LTV ≈ (ARPU × Gross Margin) / Monthly Churn
Example: ARPU €40, margin 80%, churn 3% → LTV ≈ (40 × 0.8) / 0.03 ≈ €1,066.67
Payback period
Payback (months) ≈ CAC / (ARPU × Margin)
Example: CAC €180; ARPU €40; margin 80% → monthly gross profit €32 → payback ≈ 180 / 32 ≈ 5.6 months.
Decision check
- LTV:CAC > 3:1 is a common sanity check (context specific).
- Cutting churn from 3.0% → 2.5% (−0.5 pp) increases LTV by ~20% in this example—often cheaper than raising prices.
4) A/B test uplifts: separate signal from noise
If variant B lifts CR from 5.0% to 5.4% (+0.4 pp = +8% relative), decide if it’s material:
- Is the base big enough? On 10,000 visitors, that’s 40 extra signups. Worth shipping if the downstream value is clear.
- P-values & power matter, but don’t over-rotate. Use guardrails (e.g., minimum detectable effect, sample size) and confirm practical impact (revenue, retention).
- Segment sanity: check if uplift holds across key segments (geo, device, channel). Beware Simpson’s paradox.
5) Funnel math: attack the tightest bottleneck first
Improving a tiny stage often beats small wins everywhere else. If add-to-cart → checkout is 18% and checkout → purchase is 92%, the leverage is clearly the former.
Tiny worksheet:
| Stage | Rate | 100k visitors → |
|---|---|---|
| Visit → Product View | 45% | 45,000 |
| Product View → Add to Cart | 22% | 9,900 |
| Add to Cart → Checkout | 18% | 1,782 |
| Checkout → Purchase | 92% | 1,639 |
Raising “Add to Cart → Checkout” by +4 pp (18% → 22%) yields +396 purchases at this traffic, often more ROI than chasing a +0.2 pp uplift at the already-strong checkout stage.
6) Cohorts: read the retention curve (and fix activation first)
A healthy curve flattens after an initial drop. If Month-1 → Month-2 retention collapses (e.g., 42% → 18%), the issue is usually activation, not “general” churn.
- Define a crisp activation event tied to long-term retention (e.g., “created 1st project and invited a teammate”).
- Measure uplift as percentage points in Month-2 retention when activation is achieved vs. not achieved.
- Ship one activation experiment at a time; recompute the cohort curve monthly.
8) Pricing tests: remember compounding taxes & fees
Moving €19 → €21 is +10.5% price, but your net change depends on payment fees, VAT, and refund rates. Model the net margin change, not just the top-line price delta.
Quick check: If payment fees are 2.9% + €0.30, and VAT is 19%, your net lift may be meaningfully lower than +10.5%. Do the line-item math before declaring victory.
Common mistakes (and fast fixes)
- Reporting only relative % change: Always include percentage points for clarity.
- Ignoring base size: A +50% lift on 200 users can be noise; look at absolute impact.
- Muddled timeframes: Compare week vs. week (or month vs. month) with seasonality in mind.
- Mixing churn & cancellation reasons: Separate voluntary vs. involuntary churn; fixes differ.
- Overfitting to one channel: Great percentages on a tiny channel won’t move company-level metrics.
Copy-paste mini templates
Experiment summary (one-pager)
Hypothesis:
Changing <thing> will increase <metric> from <baseline%> to <target%> (+<pp> / +<rel%>).

Design:
Traffic split: 50/50, min sample size: N=____, MDE: ____ pp, duration: ____ days.

Result:
Variant B: <new%> vs. control <baseline%> = +<pp> pp (+<rel%>).
Absolute impact: +<count> conversions / month at current traffic.

Decision:
Ship / Iterate / Roll back. Next step: ____________.
Churn reduction calculator (quick inputs)
Inputs:
ARPU = €___ ; Margin = ___% ; Current churn = ___%/mo ; Target churn = ___%/mo

Outputs:
LTV_now ≈ (ARPU × Margin) / churn
LTV_target ≈ (ARPU × Margin) / target_churn
ΔLTV ≈ LTV_target − LTV_now (→ budget for retention work)
FAQ
Should I report percentage points or relative %?
Both. Percentage points make movement intuitive; relative % communicates efficiency vs. baseline.
How do I compare channels fairly?
Normalize for stage of funnel and audience quality. A channel with lower CR can win on CAC or payback.
Is a +0.3 pp uplift worth shipping?
Depends on traffic and downstream value. Always translate pp → absolute conversions → revenue before deciding.