In today's data-driven world, organizations rely on Business Intelligence (BI) tools to transform raw data into meaningful insights. Among the most popular BI platforms, Microsoft Power BI and Tableau continue to dominate the market. Both tools help businesses analyze data, create interactive dashboards, and make informed decisions, but each has its own strengths.
Whether you're a student, business analyst, data analyst, or IT professional, understanding the differences between Power BI and Tableau can help you choose the right tool for your career.
What is Power BI?
Power BI is Microsoft's business intelligence and data visualization platform that enables users to connect to multiple data sources, clean data, build reports, and share interactive dashboards across organizations.
Power BI integrates seamlessly with Microsoft products such as:
Excel
Azure
SQL Server
Microsoft Fabric
SharePoint
Teams
Its affordable pricing and user-friendly interface make it one of the fastest-growing BI platforms worldwide.
Key Features of Power BI
Drag-and-drop dashboard creation
AI-powered insights
Natural language queries
Real-time analytics
Cloud and on-premise deployment
DAX (Data Analysis Expressions)
Power Query for data transformation
Hundreds of data connectors
What is Tableau?
Tableau is an advanced data visualization and analytics platform designed to create highly interactive dashboards with exceptional visual quality.
Known for its speed and flexibility, Tableau allows organizations to analyze massive datasets without extensive coding knowledge.
It is widely used by:
Fortune 500 companies
Financial institutions
Healthcare organizations
Marketing agencies
Retail businesses
Key Features of Tableau
Beautiful visualizations
Advanced analytics
Drag-and-drop interface
Live data connectivity
Storytelling dashboards
Geographic mapping
Predictive analytics
Integration with Python and R
Power BI vs Tableau Comparison
Feature | Power BI | Tableau |
|---|---|---|
Ease of Use | Beginner Friendly | Intermediate to Advanced |
Cost | Affordable | Premium Pricing |
Best For | Microsoft Ecosystem | Advanced Analytics |
Visualization | Excellent | Outstanding |
Performance | Great | Excellent for Large Data |
Data Preparation | Power Query | Tableau Prep |
Programming | DAX | Tableau Calculations |
AI Features | Built-in AI | Advanced Analytics |
Deployment | Cloud & On-Premise | Cloud, Server & Desktop |
Power BI Advantages
1. Cost Effective
Power BI offers one of the most affordable BI solutions available, making it ideal for startups and small businesses.
2. Microsoft Integration
Organizations already using Office 365, Excel, Azure, or SQL Server experience seamless integration.
3. Easy Learning Curve
Beginners can quickly learn Power BI because of its familiar Microsoft interface.
4. Powerful Data Modeling
Power BI's DAX language enables users to build advanced business calculations with ease.
5. AI Capabilities
Built-in AI features automatically identify trends, anomalies, and business insights.
Tableau Advantages
Superior Data Visualization
Tableau creates visually appealing dashboards that are highly interactive.
Faster Performance
It handles millions of records efficiently with optimized processing.
Advanced Analytics
Ideal for data scientists and analysts working on complex business intelligence projects.
Flexible Data Connections
Supports a wide range of databases, cloud platforms, and big data technologies.
Storytelling Features
Transforms data into compelling visual stories for executive presentations.
Industries Using Power BI and Tableau
Both tools are widely adopted across industries, including:
Banking
Healthcare
Retail
Manufacturing
E-commerce
Telecommunications
Logistics
Education
Government
Insurance
Career Opportunities
Learning Power BI or Tableau opens doors to roles such as:
Data Analyst
Business Intelligence Analyst
Reporting Analyst
Data Visualization Specialist
Business Analyst
BI Developer
Analytics Consultant
Data Engineer
Product Analyst
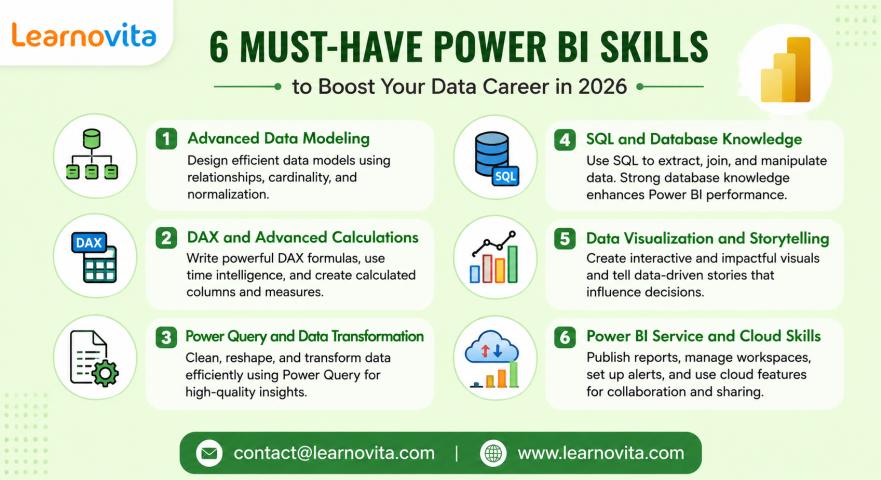
Essential Skills to Learn
To excel with either platform, develop expertise in:
SQL
Excel
Data Warehousing
ETL Concepts
Statistics
Data Modeling
Dashboard Design
KPIs and Metrics
Data Storytelling
Power BI vs Tableau: Which One Should You Choose?
Choose Power BI if you:
Are a beginner
Use Microsoft tools
Want an affordable solution
Need enterprise reporting
Aim for Microsoft-focused organizations
Choose Tableau if you:
Love advanced visualizations
Work with large datasets
Need sophisticated analytics
Want maximum dashboard customization
Many professionals choose to learn both tools, significantly increasing their employability and versatility in the analytics field.
Future of Business Intelligence
The BI landscape continues to evolve with advancements in AI and machine learning. Modern platforms now include:
AI-generated insights
Predictive analytics
Natural language querying
Automated report generation
Cloud-native analytics
Real-time business monitoring
Embedded analytics
Self-service BI
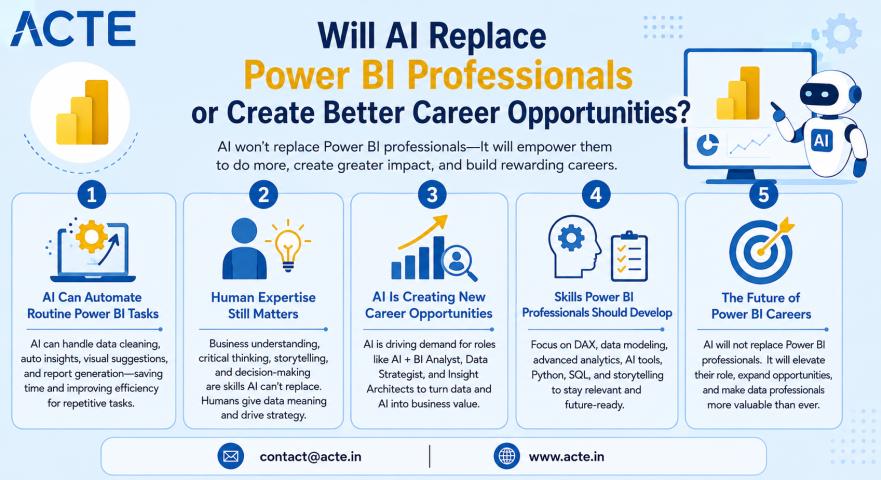
As organizations increasingly rely on data-driven decision-making, proficiency in Power BI and Tableau will remain a highly valuable skill.
Final Thoughts
Power BI and Tableau are both powerful business intelligence platforms that empower organizations to transform raw data into actionable insights. While Power BI stands out for its affordability, Microsoft integration, and ease of use, Tableau excels in advanced visualization and handling large-scale analytics.
For aspiring data professionals, learning either platform can significantly enhance career opportunities. Those seeking maximum flexibility and broader job prospects should consider mastering both Power BI and Tableau, along with SQL, Excel, and data modeling fundamentals.
Investing in business intelligence skills today can pave the way for a rewarding career in data analytics, business intelligence, and decision science.