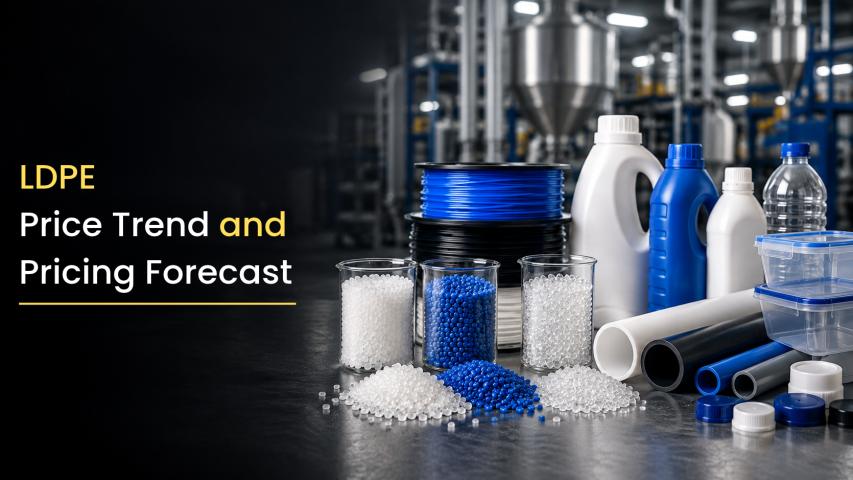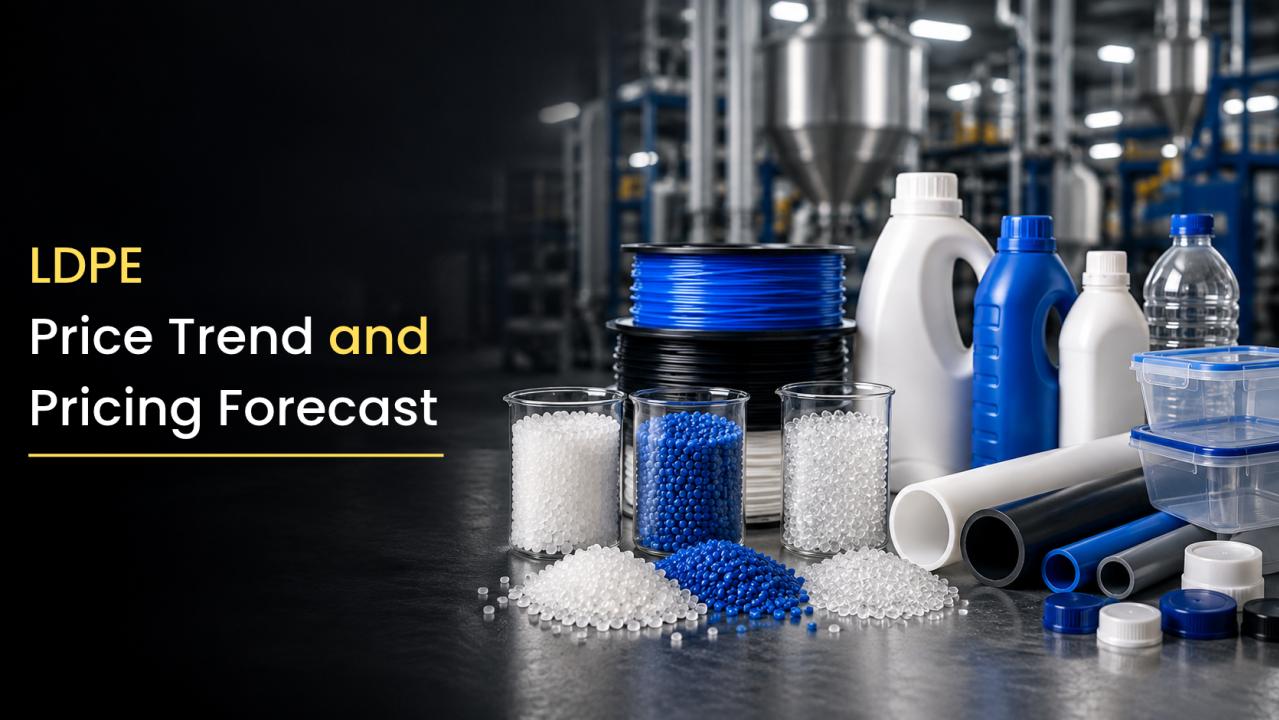
The LDPE Price Trend during
the second quarter of 2026 showed a sharp increase across major global markets,
followed by a noticeable correction in June. Low Density Polyethylene (LDPE)
prices came under pressure from rising raw material costs, supply disruptions,
higher transportation expenses, and changes in international trade flows.
The conflict between the United States
and Iran, along with the closure of the Strait of Hormuz, disrupted the
movement of important petrochemical feedstocks and reduced the availability of
LDPE in several markets.
As a result, buyers in Asia, Europe,
North America, and other regions faced higher purchasing costs. However, the
market started moving in different directions in June as geopolitical tensions
eased and some supply and freight pressures began to improve.
👉👉👉Please submit your query to get LDPE Price Trend, forecast and market
price analysis: https://www.price-watch.ai/book-a-demo/
Understanding the LDPE Market
Low Density Polyethylene is a widely
used plastic material known for its flexibility, lightweight structure, and
moisture resistance.
It is commonly used to manufacture
shopping bags, packaging films, agricultural films, flexible containers, wire
insulation, and several household products.
Because LDPE is used in everyday
packaging and industrial applications, changes in its price can affect many
businesses.
The production cost of LDPE depends
heavily on ethylene, its primary raw material. Ethylene production is closely
connected to the petrochemical industry and the availability of feedstocks such
as naphtha. When crude oil prices rise or feedstock supplies become difficult
to secure, ethylene production costs can increase. These changes can eventually
affect LDPE prices.
Transportation also plays an important
role. International buyers must consider shipping charges, insurance costs,
currency movements, and local distribution expenses when purchasing imported
material. During Q2 2026, these factors became especially important as
disruptions around the Strait of Hormuz affected feedstock movement and
increased uncertainty across international markets.
LDPE Price Trend in Q2 2026
The second quarter of 2026 was a highly
volatile period for the LDPE market. Prices increased sharply across most of
the major trading regions as producers and buyers responded to higher costs and
concerns about material availability.
The LDPE Price Trend was
supported by a combination of rising ethylene costs, restricted feedstock
movement, reduced Iranian export availability, and increased freight and
insurance expenses. Buyers who depended on imported material had to pay more to
secure shipments, while domestic producers faced pressure from higher
production costs.
According to the supplied Q2 market
data, price increases ranged from approximately 21% to 74% across the markets
covered. European markets recorded some of the strongest gains, while several
Asian markets experienced substantial increases in import prices. The United
States also recorded a major rise as higher production costs and international
demand supported export offers.
The market did not move at the same pace
everywhere. Local production capacity, import dependence, inventory levels, and
downstream demand affected the size of the increase in each country. This
difference became even clearer in June, when prices began correcting in some
regions while remaining firm in others.
Major Factors Behind the Q2 Price
Increase
1. Higher Ethylene and Naphtha Costs
Ethylene is the main raw material used
to produce LDPE. Any significant increase in its cost can influence the final
price of the polymer. During Q2 2026, disruption to naphtha and other feedstock
flows created additional pressure on petrochemical production.
The closure of the Strait of Hormuz
affected the movement of important energy and petrochemical supplies. This
increased uncertainty for producers and raised the cost of securing raw
materials. As production costs climbed, suppliers passed some of the additional
expenses on to buyers.
These cost pressures were particularly
visible in Europe, where higher ethylene contract prices contributed to
significant increases in domestic LDPE offers.
2. Reduced Availability of Imported
Material
The reduction in Iranian LDPE export
volumes added another challenge for international buyers. When an established
source of supply becomes less available, customers often turn to alternative
suppliers.
This shift can increase competition for
available cargoes and strengthen prices in export markets. Saudi-origin
material became particularly important for buyers in several Asian markets,
while US-origin material remained relevant for customers in the Americas.
As buyers searched for alternative
supplies, the market experienced additional pressure even in locations where
local production continued.
3. Higher Freight and Insurance Expenses
The cost of LDPE does not depend only on
the price quoted by a producer. Importers must also account for shipping,
insurance, port handling, and inland transportation.
During Q2 2026, uncertainty surrounding
international shipping routes increased freight and insurance expenses. These
additional costs raised the landed price of imported material in markets such
as India, Mexico, Brazil, China, and Vietnam.
For businesses that regularly purchase
large quantities of LDPE, even a moderate increase in freight expenses can
significantly affect total procurement costs.
4. Supply and Demand Differences
Supply conditions were another important
factor behind regional price movements. Some producers reduced operating rates
because of higher costs or difficult production economics, while other markets
had enough domestic capacity to limit the impact of import price increases.
Demand also varied across regions.
Packaging manufacturers continued to require LDPE, but higher prices made some
buyers more cautious. Several downstream businesses delayed purchases or used
existing inventories rather than immediately accepting expensive offers.
This combination of tight supply and
uneven demand created different pricing patterns across the global market.
LDPE Price Trend in the United States
The United States recorded a strong
increase in LDPE export prices during Q2 2026. According to the supplied data,
Free on Board (FOB) Houston offers for general-purpose film grade increased by
59% during the quarter.
Higher ethylene costs and reduced
availability of Iranian LDPE supported demand for US-origin material in
international markets. Although US crackers continued to operate at near-normal
rates, export demand and rising feedstock expenses kept prices under pressure.
The LDPE Prices in the United
States remained close to record levels for much of the quarter. This created
challenges for packaging converters and other businesses that depend on
polyethylene films.
June brought some relief. US export
offers declined by 9% as the ceasefire and reopening of the Strait of Hormuz
eased some feedstock and shipping concerns. However, the monthly decline did
not completely reverse the large increase recorded during the preceding
quarter.
LDPE Price Trend in Europe
Europe experienced some of the strongest
price increases during Q2 2026. The supplied data shows that general-purpose
film-grade LDPE prices rose by 74% in Belgium and Germany. Italy and France
recorded increases of approximately 73%.
Higher naphtha and ethylene costs played
a major role in this movement. Reduced operating rates at some petrochemical
facilities also limited domestic availability, adding further pressure to the
market.
For European packaging manufacturers,
the rapid rise in prices increased the cost of producing flexible packaging,
liners, and industrial films. Some buyers became more careful with purchasing
decisions as the cost of new material increased.
June marked a major turning point. LDPE
prices in Belgium, Germany, Italy, and France fell by 24% during the month.
Lower ethylene contract settlements and sluggish film demand contributed to
this sharp correction.
This decline showed how quickly polymer
markets can change when feedstock costs fall and demand remains weak. It also
highlighted the importance of monitoring monthly price movements rather than
relying only on quarterly averages.
LDPE Price Trend in India
The LDPE Price Trend in India
showed a strong upward movement during Q2 2026, with both imported and
domestically traded material becoming more expensive.
According to the supplied market data,
Saudi-origin LDPE import offers on a Cost, Insurance and Freight (CIF) Nhava
Sheva basis increased by approximately 41% to 44%. Higher Saudi export prices,
increased freight expenses, and rising insurance costs contributed to the
increase.
Domestic prices also moved higher.
Ex-Ahmedabad and other western Indian market prices for injection moulding,
heavy-duty film, and general-purpose film grades increased by around 29% to
32%. Currency depreciation and tight producer inventories added to the
pressure.
These increases affected businesses that
use LDPE for packaging films, shopping bags, agricultural applications, and
flexible packaging products. When the price of resin rises quickly, converters
may need to revise quotations, manage inventories more carefully, or negotiate
new purchasing terms with customers.
Interestingly, India's market showed a
different pattern in June. Saudi-linked import offers declined by 8%,
reflecting lower export offers and easing freight costs. However, domestic
Ex-Ahmedabad and western Indian prices increased by a further 1%.
This difference suggests that
international price corrections do not always pass immediately into domestic
markets. Local inventories, producer pricing decisions, currency movements, and
distribution costs can continue to influence domestic prices even when import
costs begin to fall.
LDPE Price Trend in China and Other
Asian Markets
China recorded a mixed pricing pattern
during Q2 2026. Saudi-origin LDPE import offers increased by approximately 36%
to 37%, while domestic Ex-Ningbo film-grade prices rose by around 21%.
Higher export prices and transportation
costs made imported material more expensive. At the same time, additional
domestic LDPE and LDPE-EVA capacity helped limit the increase in local prices.
In June, Saudi-linked import prices
declined by 6%, while domestic Ex-Ningbo prices fell by 9%. The larger domestic
correction reflected the availability of local material and pressure from new
capacity.
Vietnam also experienced a strong
increase, with Saudi-origin import offers rising by approximately 42% to 43%
during Q2. Prices declined by 5% in June as export offers and freight expenses
eased.
Saudi Arabia recorded increases of
around 37% to 38% in its export offers during the quarter, followed by a 5%
decline in June. These movements demonstrate the close connection between
feedstock costs, export availability, and import prices across Asian markets.
LDPE Price Trend in Mexico and Brazil
Mexico and Brazil both experienced
substantial increases in US-origin LDPE import prices during Q2 2026.
In Mexico, CIF Manzanillo offers for
general-purpose film grade rose by 57%. Higher US export prices, transportation
costs, insurance expenses, and currency-related pressures contributed to the
increase. Prices then declined by 8% in June.
Brazil recorded a similar 57% increase
in CIF Santos import offers for US-origin material. Higher production costs in
the United States and increased shipping expenses affected the landed price of
LDPE in the Brazilian market. June brought an 8% correction as export offers
and freight costs eased.
These markets demonstrate why
import-dependent buyers need to monitor both the producer's selling price and
the additional expenses involved in bringing material into the country.
LDPE Price Chart: Understanding the
Market Movement
The LDPE Price Chart for Q2 2026
highlights two distinct stages: a sharp rise during the quarter and a
correction in June across several markets.
The largest quarterly increases were
recorded in parts of Europe, where prices rose by approximately 73% to 74%. The
United States recorded a 59% increase, while Mexico and Brazil both experienced
gains of 57%. India recorded increases of 29% to 44%, depending on the product
grade and whether the material was imported or domestically traded.
June movements were more varied.
European prices fell by 24%, while US prices declined by 9%. India experienced
an 8% decrease in Saudi-linked import offers but a further 1% increase in
domestic prices. China recorded declines of 6% for Saudi-linked imports and 9%
for domestic material.
When reviewing a price chart, buyers
should compare the same grade, specification, location, and pricing basis. An
import price quoted on a CIF basis cannot be directly compared with a domestic
ex-warehouse or ex-depot price without considering transportation, handling,
and other costs.
It is also important to distinguish
between quarterly price changes and monthly corrections. A decline in June does
not necessarily mean prices have returned to their levels before the Q2 rally.
LDPE Price Index: What the Q2 2026 Data
Shows
The LDPE Price Index provides a
useful way to understand the overall direction of the market. During Q2 2026,
the index movement across major regions reflected rising production costs,
reduced export availability, and higher transportation expenses.
However, the June correction
demonstrated that the market was not moving uniformly. European prices declined
sharply as ethylene costs fell and film demand remained weak. Asian markets
recorded smaller import price reductions because supply constraints continued
to affect availability. India showed a split between lower import offers and
slightly higher domestic prices.
For buyers, an index is most useful when
it tracks a consistent grade, location, and pricing basis over time. Comparing
several periods helps businesses identify whether a price change is temporary
or part of a broader market movement.
A reliable price index can also support
procurement planning, supplier negotiations, budgeting, and inventory
decisions. It should be considered alongside actual purchase quotations, stock
levels, and expected consumption rather than used as the only basis for buying
decisions.
LDPE Price Forecast: What Could Happen
Next?
The LDPE price forecast will depend on
several important factors, including feedstock availability, ethylene prices,
shipping conditions, producer operating rates, and demand from packaging and
industrial sectors.
If international shipping continues to
normalize and feedstock supplies improve, producers may face less pressure to
maintain exceptionally high prices. Lower freight costs could also reduce the
landed cost of imported LDPE in markets that depend heavily on overseas
supplies.
However, a complete and immediate return
to earlier price levels cannot be assumed. Producers may continue to manage
output carefully, and inventories may take time to adjust after a period of
rapid price increases. Currency movements could also affect import costs in
markets such as India.
Demand will be equally important. If
packaging manufacturers increase production and rebuild inventories, demand for
LDPE could provide support to prices. On the other hand, weak consumer demand
or continued caution among converters could limit further increases.
India may continue to show differences
between domestic and imported material. Even if international offers decline,
local prices could remain firm because of inventory conditions, supply
discipline, and distribution costs.
For businesses purchasing LDPE, the most
practical approach is to monitor feedstock prices, import offers, domestic
quotations, and freight costs together. Regularly reviewing these indicators
can help buyers make more informed decisions without assuming that prices will
move in one direction throughout the year.
How Businesses Can Manage LDPE Price
Volatility
Rapid price changes can make procurement
difficult, particularly for small and medium-sized packaging manufacturers. A
few practical steps can help reduce the impact.
First, buyers should review their
inventory requirements and avoid making purchasing decisions based only on
short-term market expectations. Maintaining an appropriate stock level can help
protect production schedules without creating unnecessary storage costs.
Second, businesses should compare
quotations from different suppliers while checking whether the material
specifications and delivery terms are comparable. A lower quoted price may not
always mean a lower final cost if freight, handling, or payment terms differ.
Third, companies should communicate
regularly with customers about changes in raw material costs. Where commercial
agreements allow, timely price revisions can help manufacturers manage sudden
increases in resin expenses.
Finally, procurement teams should follow
the LDPE Price Chart and LDPE Price Index regularly. Reviewing price movements
by grade and region can help businesses identify changing market conditions
earlier and prepare for possible corrections or renewed increases.
Conclusion
The LDPE Price Trend in Q2 2026
was shaped by a major combination of geopolitical disruption, higher ethylene
and naphtha costs, reduced Iranian export availability, and rising freight and
insurance expenses. Prices increased sharply across the United States, Europe,
Asia, India, Mexico, and Brazil, although the scale of the increase varied by
market.
June brought a significant correction in
several regions, particularly Europe, where prices declined by 24%. The United
States, China, Vietnam, Saudi Arabia, Mexico, and Brazil also recorded lower
prices in different segments. India stood out because imported offers declined
while domestic prices edged higher.
The overall market experience shows that
LDPE prices depend on more than raw material costs alone. Supply availability,
domestic production, import dependence, currency movements, shipping expenses,
and end-user demand all play important roles.
Going forward, buyers should closely
monitor the LDPE Price Chart, LDPE Price Index, and changes in international
trade conditions. Understanding these factors can help businesses plan
procurement, manage operating costs, and respond more effectively to changing
market conditions. Although the June correction offered some relief, future
prices will depend on how feedstock supplies, shipping conditions, and
downstream demand develop in the coming months.
👉👉👉Please submit your query to get LDPE Price Trend, forecast and market
price analysis: https://www.price-watch.ai/book-a-demo/
About
Price Watch™
Price Watch™ is an independent raw material price reporting
agency that provides real-time price forecasts and data-driven insights into
global raw material markets. Price-Watch™ specializes in tracking raw material
prices, analyzing market trends. and delivering timely updates on plant
shutdowns, supply disruptions, capacity expansions, and demand-supply dynamics.
The Price-Watch™ platform empowers manufacturers, traders, and procurement
professionals to make faster, smarter decisions. Leveraging AI-powered
forecasting and over a decade of historical data, Price-Watch™ transforms
market volatility into actionable opportunity.
Futura Tech
Park,
C Block,
8th floor 334,
Old
Mahabalipuram Road,
Sholinganallur,
Chennai,
Tamil Nadu,
Pincode - 600119.
LinkedIn:
https://www.linkedin.com/company/price-watch-ai/
Facebook:
https://www.facebook.com/people/Price-Watch/61568490385598/
Twitter: https://x.com/pricewatchai
Website: https://www.price-watch.ai/